

ERDC/CHL CHETN-VII-5
December 2003
the application of the ISSDOT method. To illustrate this, consider the three data collection trips to
Pool 8 in which there was no drawdown. These are trips 1, 3, and 4. The data obtained during these
trips were taken with a downstream pool elevation at L&D 8 of about el 630.1 to 630.5. However,
the flows through L&D 8 were significantly different for the three trips. Trip 1 had a flow of
about 3,555.6 cu m/sec (96,000 cfs). Trip 3 was 1,074 cu m/sec (29,000 cfs), and trip 4 was
2,185.2 cu m/sec (59,000 cfs). If the data collection and ISSDOT method are consistent as
previously proposed, then this fact should be reflected in increasing transport gradients for
increasing flow rates; all other factors being equal.
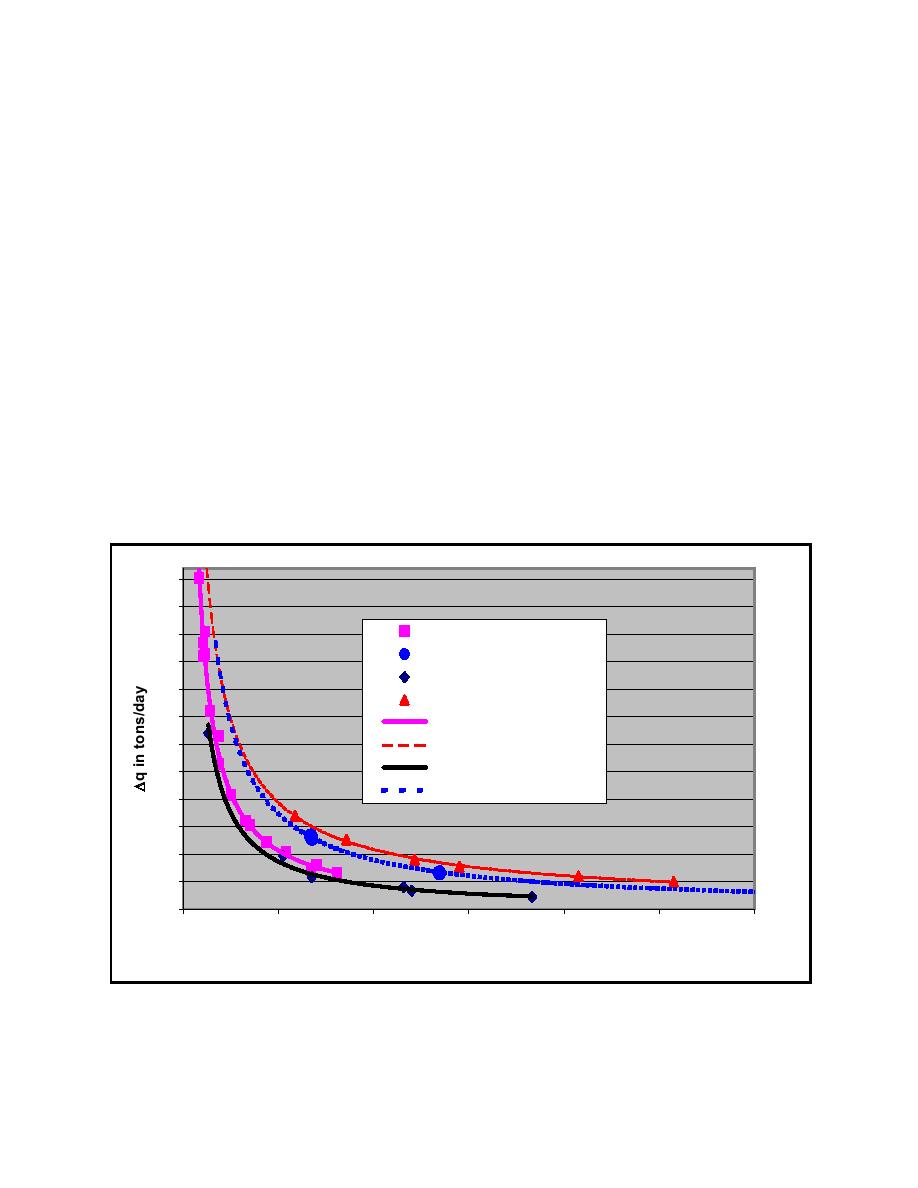
The data in Figure 5 seem to justify this consideration. ∆q for trip 4 falls between that of trip 3 and
trip 1. Clearly for the three trips, ∆q increases with increasing flow. Since curves were fitted through
each data set, it is easy to see the differences. The method appears to be consistent in that, as flow
rate increases, ∆q increases. It also seems reasonable to allow that for similar flow rates the sand
transport should be the same at a given site if all other factors are held constant. In the case of trip 2
and trip 4, the flow rates were indeed the same. One factor was not held constant, that was the
drawdown. As stated earlier, it was a reduction of the pool water level at L&D 8 of about 0.5 m
(1.5 ft). In the vicinity of the study area near Brownsville, this caused a local drawdown of about
0.3 m (0.9 ft). The data lines for trip 2 and trip 4 seem to indicate clearly that the drawdown did in
fact have a net effect of increasing the ∆q in the vicinity of the study area. This could be true not
only because the cross-sectional area at the study site was reduced, but also because the percentage
600
550
trip4: 59,000 cfs
500
2
R = 0.993
Trip2: 59,000 cfs
450
trip3: 29,000 cfs
400
trip1: 96,000 cfs
350
Power (trip4: 59,000 cfs)
300
Power (trip1: 96,000 cfs)
Power (trip3: 29,000 cfs)
250
Power (Trip2: 59,000 cfs)
200
150
100
50
R2 = 0.9988
0
0
2
4
6
8
10
12
∆t in hours
Figure 5. ∆q versus ∆t computed using ISSDOT for stated conditions (Tons/day vs. time span between
measurement of two sections. Average of 30 rows at each ∆t. Data from trip 1, 2, 3 and 4)
7

 Previous Page
