ERDC/CHL CHETN-VII-5
December 2003
Net Main Channel Volume Change
(cu yd)1
60000.00
40000.00
20000.00
0.00
-20000.00
-40000.00
1999 - 2001
2001 - 2002
2002 - 2003
River Mile 686 - 687
River Mile 687 - 688
River Mile 688 - 689
River Mile 689 - 690
River Mile 690 - 691
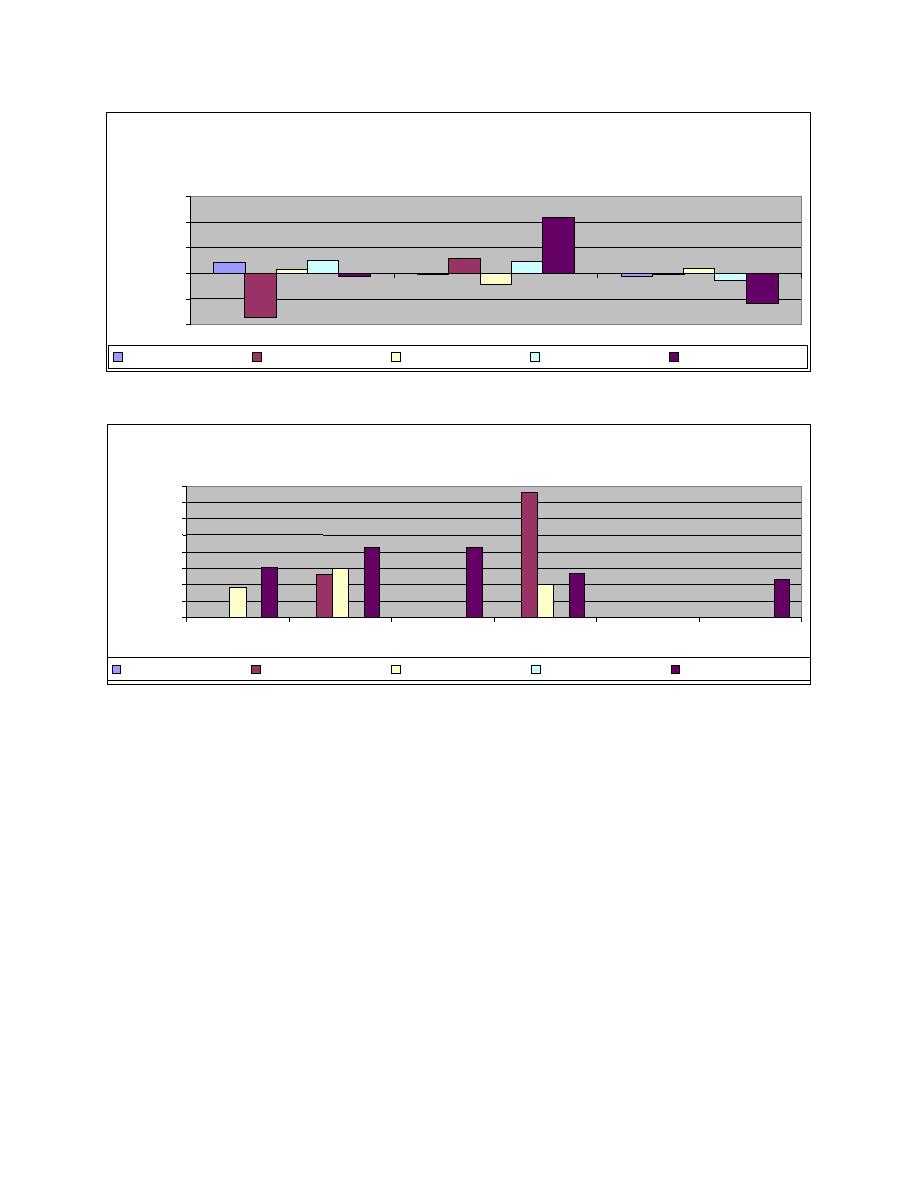
Figure 7. Main channel volume change by year for study area locations
Pool 8 Dredging by Year (cu yd)
80000.00
70000.00
60000.00
50000.00
40000.00
30000.00
20000.00
10000.00
0.00
1998
1999
2000
2001
2002
2003
River Mile 686 - 687
River Mile 687 - 688
River Mile 688 - 689
River Mile 689 - 690
River Mile 690 - 691
Figure 8. Dredging by year for study area locations
October (well after the large amount of dredging done earlier in the year), 2002 surveys were done in
late October, and 2003 surveys were taken from April to June. Because of these inconsistencies,
caution should be used in interpreting these results. For instance, surveys done early in the
navigation season may show a shallower channel due to the spring floods, while a survey later in the
navigation season after dredging was done may show a deeper channel.
1999 to 2001 time period
Figure 8 shows the large amount of channel dredging done in June 2001 prior to the drawdown.
120,000 cu yd were dredged in 2001 and 210,000 cu yd in the other years shown. This dredging
activity is partially reflected in the main channel volume changes shown in Figure 7. Between
RM 687 and 688, there was a net degradation of about 35,000 cu yd, which is due to the dredging
that was done in June 2001. From RM 688 to 689 and RM 690 to 691, about 20,000 and 25,000 cu
yd of sand were dredged from each cut in June 2001 (Figure 8). However, both reaches are dredged
________________________
1
To convert cubic yards to cubic meters, multiply by 0.7645549.
10


 Previous Page
