

ERDC/CHL CHETN-VII-5
December 2003
180
160
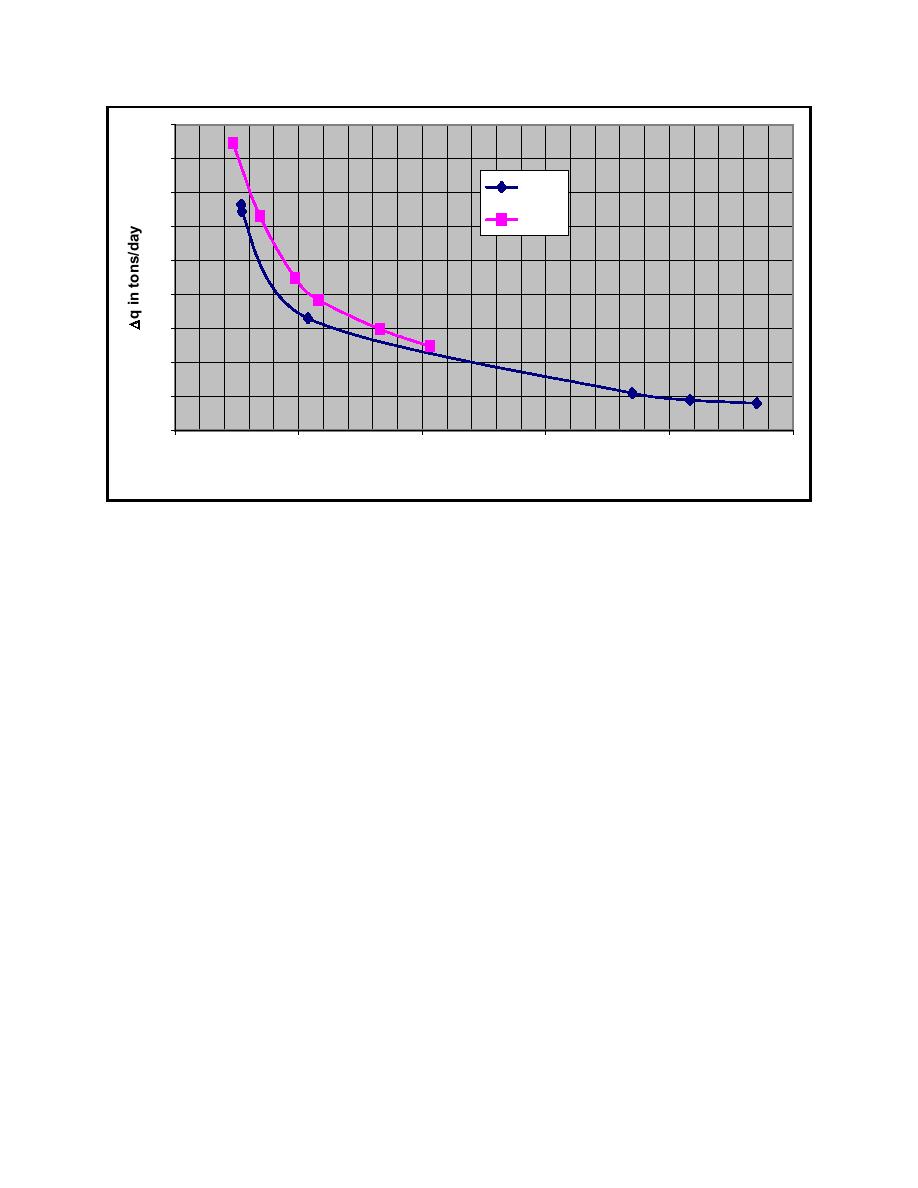
trip 2
140
trip 1
120
100
80
60
40
20
0
0
5
10
15
20
25
∆t in hours
Figure 3. ∆q versus ∆t as computed using ISSDOT for stated conditions (Tons/day vs. time span between
measurement of two sections. Values are average of 30 rows at each ∆t)
L&D 8 for trip 1 was about 3,592.6 cu m/sec (97,000 cfs) compared to about 2,185.2 cu m/sec
(59,000 cfs) for trip 2. For trip 1 there was no drawdown, yet the flow rate through the dam was
about 1.6 times greater than during trip 2. Figure 3 shows that the bed load ∆q at the section of river
represented by the brown swaths was clearly higher during trip 1. This is what would be expected if
there had been no drawdown during trip 2. Since there was a drawdown during trip 2, and the flow
rates during trip 1 and trip 2 were so different, nothing definite can be said as to whether or not the
drawdown caused any significant increase in sediment mobilization.
From the initiation of the project and in planning the data collection it was realized that in order to
say anything about increases or decreases in sediment transport due to the drawdown, it would be
necessary to hold as many other variables constant as possible. The most important of these appeared
to be flow rate. The river did not cooperate, and in trip 1, 2, and 3, the flow rates through L&D 8
were widely divergent. However, by carefully watching the District Web site during late June of
2002, the trip 4 data were collected at a flow rate through L&D 8 nearly the same as in trip 2. By that
time, more analysis of ISSDOT method data had indicated that shorter time intervals between swaths
would give results closer to an estimated true bed-load transport rate. So the swaths for trip 4 were
taken at about 30-min intervals. Unfortunately, this was not known yet when trip 2 data were
obtained. Figure 4 shows a comparison of trip 2 (drawdown) and trip 4 (no drawdown) ISSDOT bed-
load ∆q computations.
5

 Previous Page
