

ERDC/CHL CHETN-VII-5
December 2003
have been entered, and secondly, in
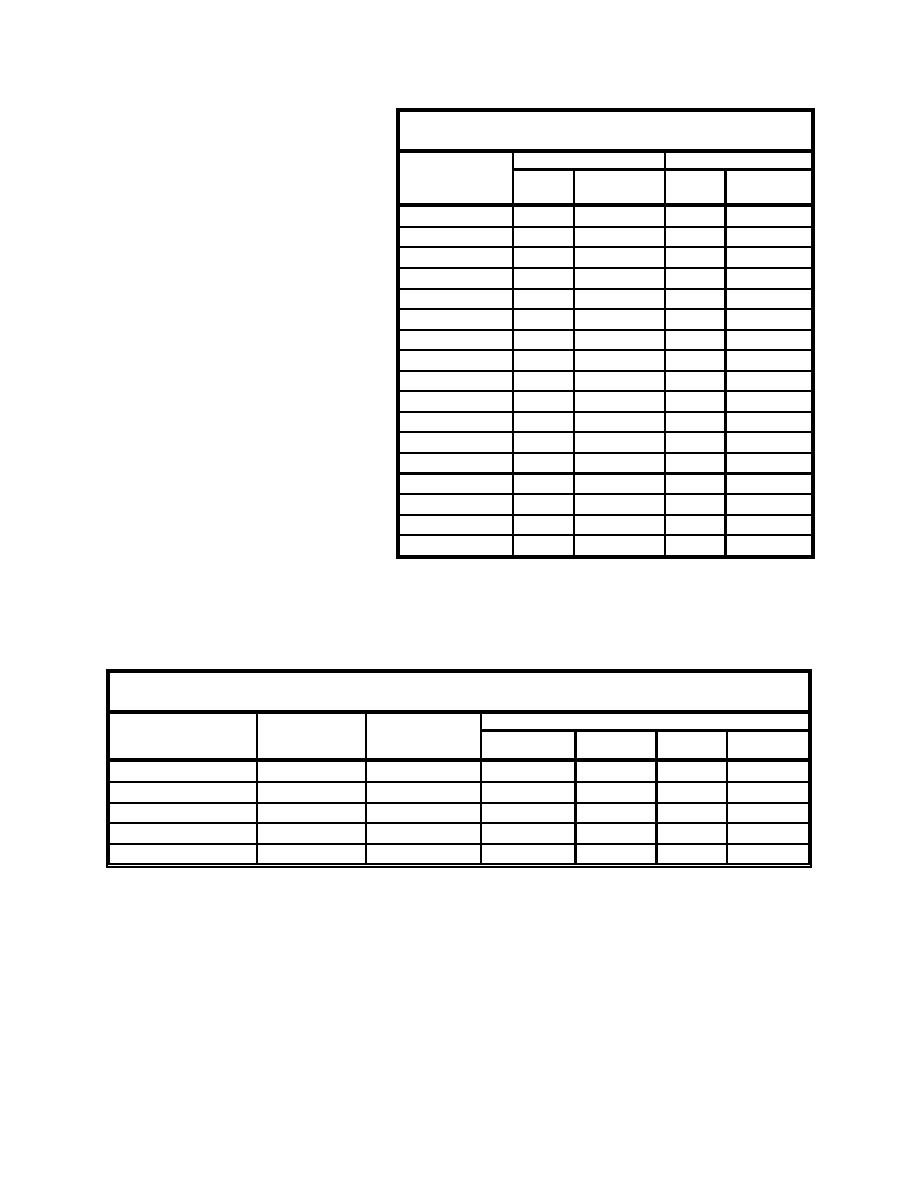
Table 1
further studies, it might be useful to
Transport Function Output Values
know more about suspended load
TRIP 1
TRIP 2
estimates as well. These functions are
Capacity Concentration Capacity Concentration
Function
tons/day ppm
tons/day ppm
listed in Table 1.
Toffaleti
1,850
19
268
3
The five functions used to compute Toffaleti bed load
175
82.5
bed load are the following: Toffaleti, Yang
1,490
15
219
2
Meyer-Peter-Mueller (MPM(1948)), Einstein (total)
919
9
526
6
Schoklitsch, Einstein bed load, and Ackers-White
1,958
20
253
3
Van Rijn bed load. The sediment and Colby
4,416
45
2,547
29
hydraulic data used as input to the MPM (1948)
723
7
188
2
transport functions are listed in Laursen-Madden 1,998
20
235
3
Table 2. These data were not esti- Laursen-Copeland 3,677
37
852
10
mated, but consisted of actual field Yang D50
1,352
14
202
2
measurements. For each trip, they Ackers-White D50 2,156
22
295
3
were collected as closely in time as Schoklitsch (bed)
121.8
1.25
0
possible. This included bottom sam- MPM(1948) D50
973
10
220
2
ples for the bed gradations and Einstein bed load
653
7
399
5
acoustic data to determine velocity Engelund-Hanson 3,096
32
643
7
profiles and discharge, as well as to Van Rijn
2,215
23
215
2
define the site cross section. The Van Rijn bed load
637.5
126.6
discharge measurements at the study
site are not the same as the flow through L&D 8. This is because the total flow through the lock and
dam includes flow in the main channel, as well as the floodplain and distributaries. A plot of the two
cross sections at the time the measurements were made is shown in Figure 9.
Table 2
Input Data for Transport Functions
Average Sediment Characteristics for Trips 2 and 4
Grain Size
Grain Size
Trip 2
Trip 4
% Finer
mm
% Finer
mm
Flow (cfs)
35,893
31,971
D05
0.18
d50
0.35
Water slope
0.00007
0.00003
D10
0.21
d60
0.44
Water surface
630.38
632.23
D20
0.24
d70
0.78
Cross-section area
15,246
17,485
d30
0.27
d80
1.26
Average channel velocity
2.35
1.83
d40
0.31
d95
1.79
The computed values of bed-load transport, that is, the portion of bed material load estimated or
represented as moving in the sand waves, are shown in Figure 10.
Regarding this study, two important results shown in this graph need to be emphasized. The first is
that the magnitudes of the transport rates fall within the same range as ∆q computed using ISSDOT.
For trip 2, when the line in Figure 5 is extrapolated as shown, its highest values are in the range of
600 to 800 tons per day. For Trip 4, the highest values are right at 600 tons per day. The low values
12

 Previous Page
