

ERDC/CHL CHETN-VII-5
December 2003
400
900
t4-TPD-1sf-grid
800
350
t4-TPD-4sf-grid
-0.9557
t2: y = 335.98x
700
t2-TPD-1sf-grid
300
t4-Vol-1sf-grid
600
250
t4-Vol-4sf-grid
500
Power (t4-TPD-1sf-grid)
200
Power (t2-TPD-1sf-grid)
400
150
300
Note: Line for Trip 2 is extrapolated left of the data points by a power
100
function.
200
50
100
-0.9891
t4: y = 211x
0
0
0
1
2
3
4
5
6
∆t in hours
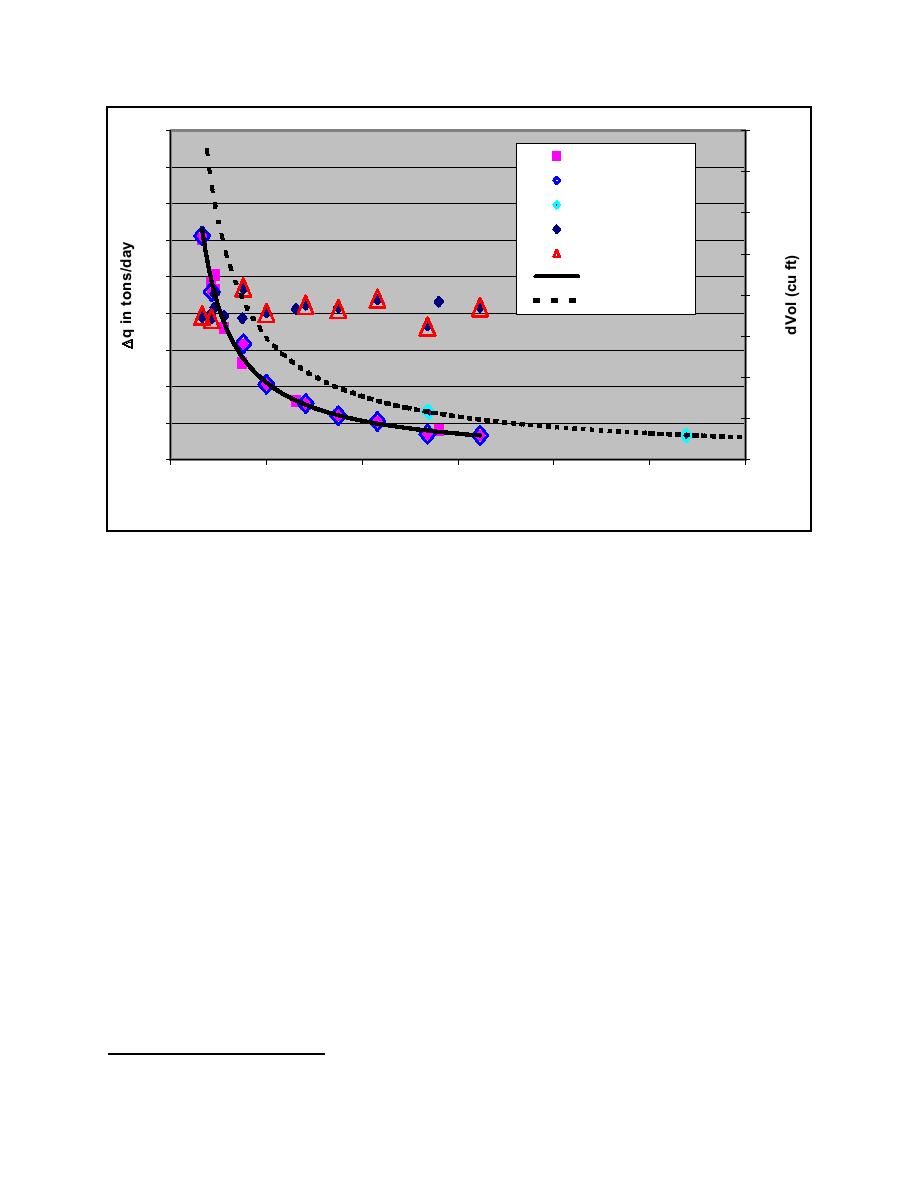
Figure 4. ∆q versus ∆t computed using ISSDOT for stated conditions change in volume used to compute
∆q for each ∆t is also shown (Tons/day vs. time span between measurement of two sections.
Average of 30 rows at each ∆t. Data from trip 4 and 2)
In the legend the first line means trip 4 ∆q in tons per day for a 1-sq ft grid.1 All lines in the legend
use this same convention. One- and four-sq ft grids were used for the computations to check the
method's spatial sensitivity. For these data and those two grid sizes, there wasn't much difference in
the computational results. Considering the plotted values, the two data points for trip 2 data between
the 2.5- and 3-hr time spans fall clearly above the data trend for the trip 4 data. Since both data sets
were taken at nearly identical flow rates, one could propose that the trip 2 data points do in fact
indicate an increase in bed-load mobilization due to the drawdown. However, two data points are
insufficient to assert any statistical significance. But, these data taken together with other relevant
data and analysis could make a strong case for the increase of bed-load mobilization due to the
drawdown. Towards this goal, something needs to be said regarding the ISSDOT method of
computing bed-load transport, since it was used to arrive at the data plotted in Figures 3 and 4.
The ISSDOT method is new and still in a development stage. So far, the preliminary results of field
tests and a flume study indicate that the method is capable of determining the bed-load transport
gradient (∆q) on large sand bed rivers. This is of course subject to certain limitations. As stated
earlier, at the present time it cannot be said that the method provides a quantitative value for the true
bed-load transport rate of a large river. However, given the way the data are collected and analyzed,
it does appear to be able to quantify relative differences of transport gradients at a given location.
The reason for this is the quality and repeatability of the collected data, as well as the consistency in
1
To convert to kilograms per square meter, multiply number of tons by 9,764.856.
6

 Previous Page
