

P. Wang et al. / Coastal Engineering 46 (2002) 175211
197
values at various cross-shore locations. Within 3 cm
4.4. Vertical and cross-shore variations of time-
from the bed, the sediment concentration was more
averaged sediment concentration
than 1 g/l at nearly all cross-shore locations. Above 10
cm from the bed, the suspended sediment concentra-
Time-averaged sediment concentration was great-
tion was usually less than 0.3 g/l. Above 15 cm from
est near the bottom and decreased rapidly upward
the bottom, the average sediment concentration was
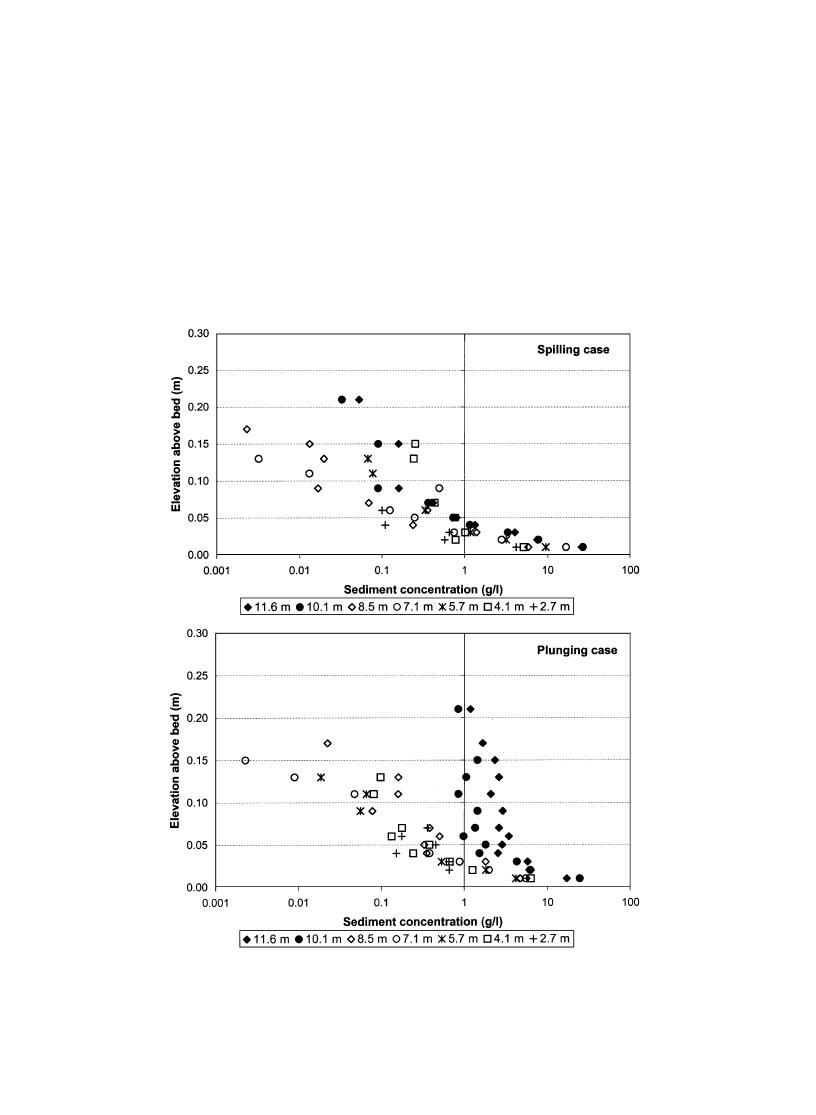
through the water column. Fig. 17 shows the time-
generally less than 0.02 g/l. An exception occurred at
averaged sediment-concentration profiles across the
the plunging breaker line, where suspended sediment
surf zone for both spilling (upper panel) and plunging
concentration above 3 cm from the bed remained
(lower panel) cases. Data in Fig. 17 represent average
Fig. 17. Profiles of time-averaged suspended-sediment concentration at various locations across the surf zone. Legends indicate distance from
shoreline.

 Previous Page
