

194
P. Wang et al. / Coastal Engineering 46 (2002) 175211
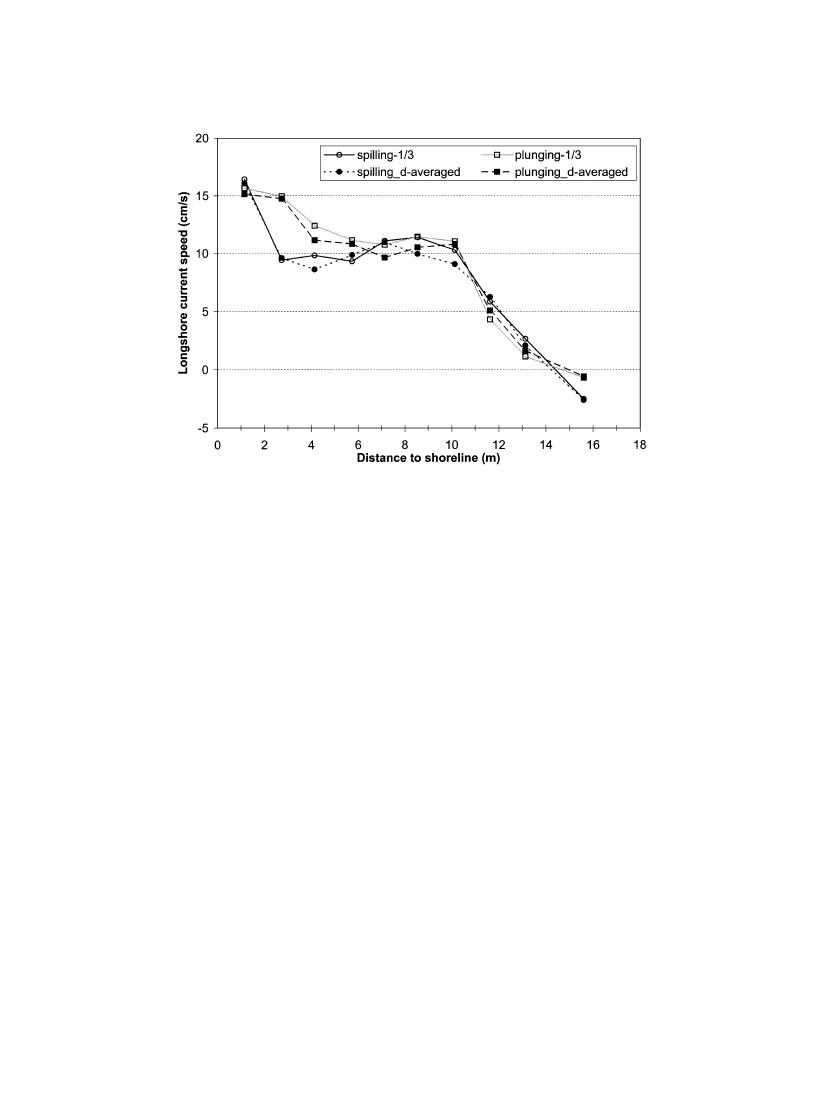
Fig. 14. Cross-shore distribution of longshore current and comparison between depth-averaged velocities and velocities measured at an elevation
of 1/3 still-water depth from the bed.
cross-shore current shown in Figs. 15 and 16 for
have also been reported from field studies (e.g.,
the spilling and the plunging cases, respectively,
emphasize the offshore-directed portion below the
data collected by Thornton and Guza (1986) over a
wave trough. Provided that the alongshore uniform-
dissipative nearly planar beach showed a longshore
ity assumption is upheld, the unmeasured portion
current peak well within the surf zone.
of the water column is assumed to balance the
The similar cross-shore distribution patterns of
measured undertow in order to satisfy mass con-
longshore current measured for these two different
servation.
wave cases, over considerably different equilibrium
The peak of the undertow was typically measured
beach profiles, indicates that the cross-shore distribu-
between 5 and 10 cm from the bed, or 25% to 45% of
tion was not significantly influenced by breaker type,
the still-water depth from the bottom, at most cross-
even near the breaker line. The vertical current pro-
shore locations. In the plunging breaker zone (ADVs
files measured across most of the mid-surf zone for
7 and 8), the peak undertow was approximately 50%
both cases were also similar (Figs. 12 and 13).
greater than that measured in the spilling breaker
zone, 7 10 vs. 4 6 cm/s (Figs. 15 and 16). The
4.3.2. Vertical and cross-shore variations of time-
undertow was also stronger across most of the mid-
averaged cross-shore current
surf zone for the plunging-wave case.
The vertical profiles of time-averaged cross-shore
The shapes of the cross-shore current profiles can
current exhibited different shapes when compared to
be represented reasonably well with parabolic curves
the logarithmic longshore-current profiles. Gener-
ally, offshore-directed mean flow was measured in
a parabolic shape occurred during the plunging case.
the lower portion of the water column and onshore-
The average correlation coefficient of the least-
directed flow near the water surface. Only a small
square curve fitting, R2, for the eight profiles for
portion of the onshore-directed flow was measured
due to the difficulties associated with collecting data
the spilling case was 0.83, with a standard deviation
of 0.13, or 16% of the mean. The average R2 value
near the free surface. The profiles of time-averaged

 Previous Page
