

198
P. Wang et al. / Coastal Engineering 46 (2002) 175211
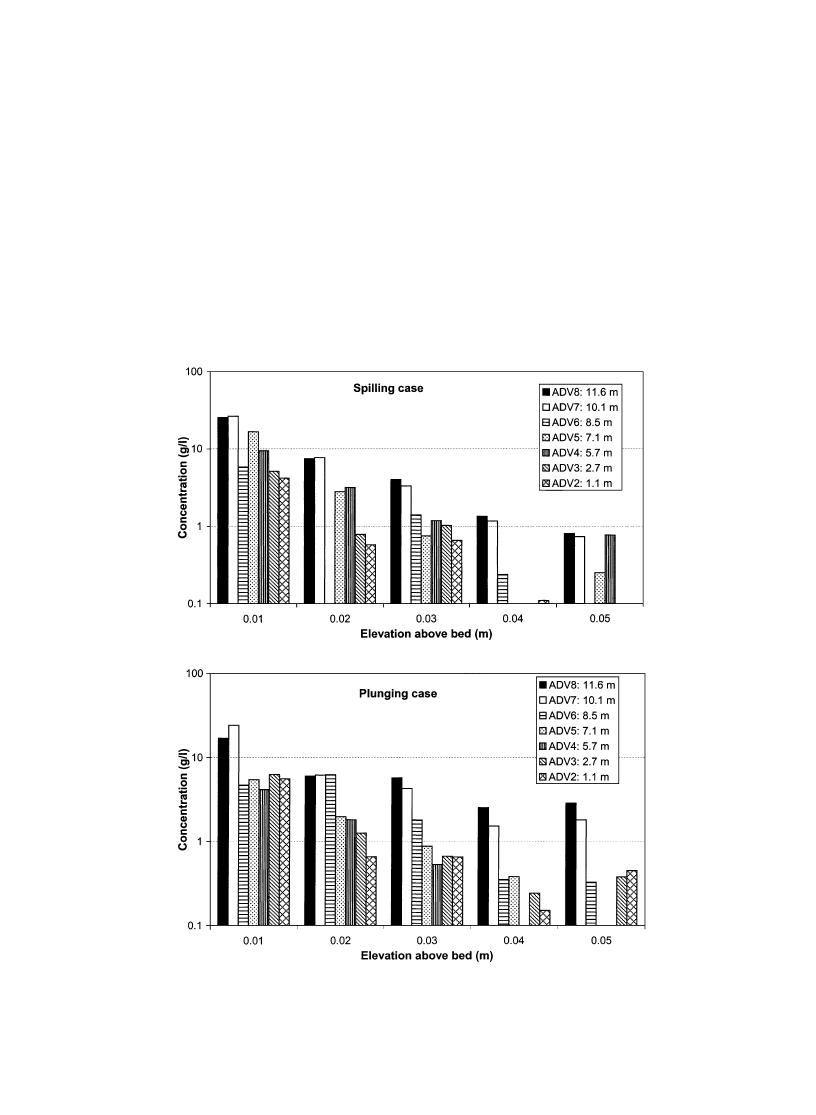
values), sediment concentrations measured at the
nearly constant ranging from 1 to 3 g/l. This nearly
same vertical elevations but at various cross-shore
uniform sediment concentration at the plunging
locations were compared, for both spilling (upper
breaker line is likely related to the intense turbulence
panel) and plunging cases (lower panel). A general
and mixing generated by the plunging type of wave
decreasing trend from the offshore ADV8 (11.6 m) to
breaking and resulting sediment suspension. The
the nearshore ADV2 (1.1 m) is apparent. The reasons
slow-settling speed of the fine sand, 1.8 cm/s, also
for this landward decreasing trend are not completely
contributes to the nearly homogeneous concentration
clear, but this is probably related to the reduction in
profile.
wave energy through the surf zone.
A careful examination of the sediment concentra-
Comparison between the top and bottom panels of
tion within 5 cm from the bed indicates a general trend
of decreasing concentration from the breaker line to
centrations were rather similar for the spilling and the
the shoreline. In Fig. 18 (also representing average
Fig. 18. Comparison of time-averaged suspended sediment concentration within 5 cm from the bed at various locations across the surf zone.

 Previous Page
