

200
P. Wang et al. / Coastal Engineering 46 (2002) 175211
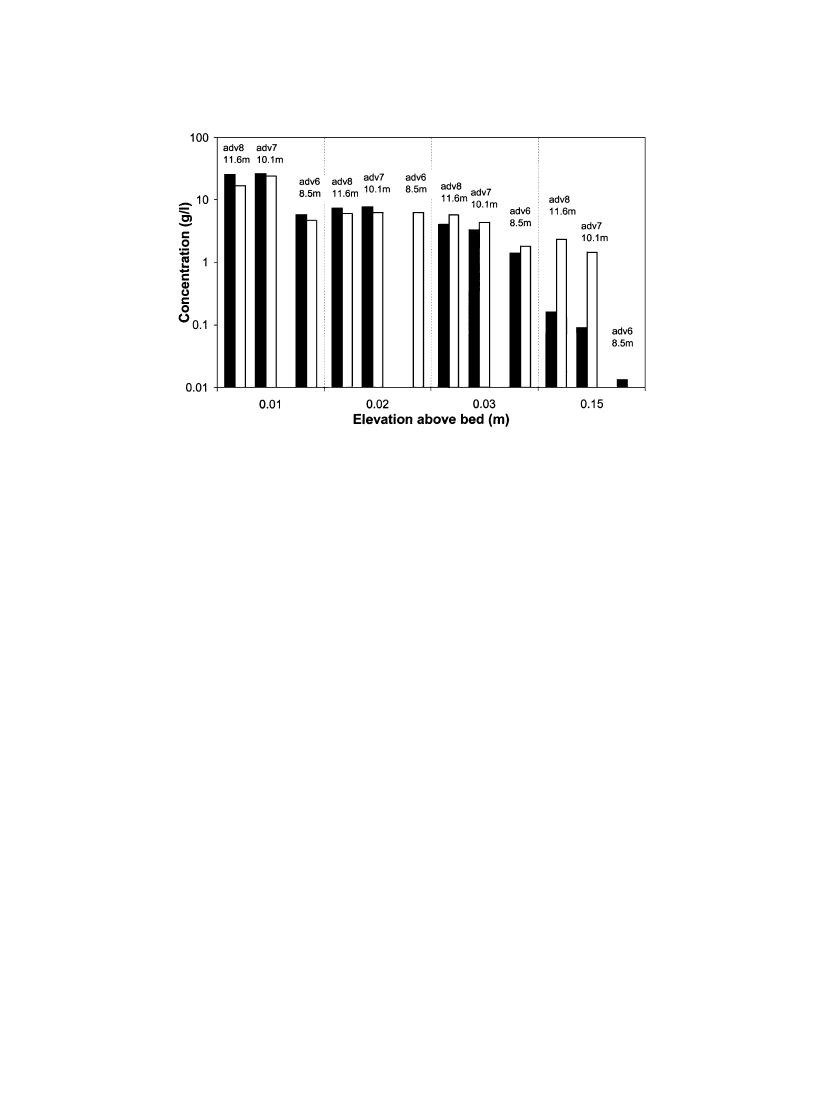
Fig. 20. Comparison of near-bed sediment concentration in the breaker zone between spilling (solid) and plunging case (clear).
the lack of understanding between the fluid flow and
atively featureless bed in the vicinity of the plunging
the sediment concentration under breaking waves.
breakers indicates a sheet-flow condition and was
Nearly identical near-bed, time-averaged sediment
very different from the rippled bed regime under the
concentrations were measured by Nielsen (1979), and
spilling breakers. The relatively large near-bed veloc-
summarized in Nielsen (1992, p. 219), for nonbreak-
ity of 34 cm/s also supports the presence of a sheet-
ing waves and spilling breakers. A conclusion was
flow regime.
drawn that except for the extreme case of a plunging
jet hitting the bed, the pickup rate at the bed and hence
m) at an elevation of 3 cm from bed, was much
the near-bed sediment concentration was not affected
greater under the longer-period plunging breakers
by the spilling breaking. Nielsen (1992, p. 219)
than under the spilling breakers, 34 vs. 19 cm/s. A
further concluded that the main effect of the turbu-
sharp drop of Ub-rms was measured in shallower
lence from wave breaking is a vertical stretching of
water at ADV7 (10.1 m) for the plunging case,
the concentration profile, i.e., greater concentration
resulting in a similar value with the spilling case.
high in the water column. Data from these two LSTF
The vertical profile of the root-mean-square (rms)
experiments seem to indicate that even when the
velocity at ADV8, which was located immediately
plunging jet was hitting the bed, the near-bed sedi-
seaward of the bar crest where larger waves broke,
ment concentrations, albeit landward and seaward of
was considerably different from the rms-velocity
the predominant plunging point, were still remarkably
profiles measured at other cross-shore locations
similar. Nearly identical near-bed, time-averaged con-
centrations were also measured by Bosman (1982),
an upward increasing trend, was measured. This
and summarized in Van Rijn (1993, p. 8.18 8.19),
probably resulted from wave deformation as it prop-
under nonbreaking waves, spilling breakers, and
agates over the bar. The rms-velocity profiles meas-
plunging breakers. Bosman (1982) used direct
ured at ADV7 (10.1 m) and landward were rather
pump-suction samplers instead of optical sensors.
similar for both the spilling and the plunging break-
No interpretation for the ``approximately constant''
ers, agreeing with the similar near-bottom velocities
near-bed concentrations was provided.
Average sediment concentration over the measured
near-bed sediment concentration and the vast differ-
part of water column (Ca_water_column) was calculated
ence throughout most of the water column highlight

 Previous Page
