

204
P. Wang et al. / Coastal Engineering 46 (2002) 175211
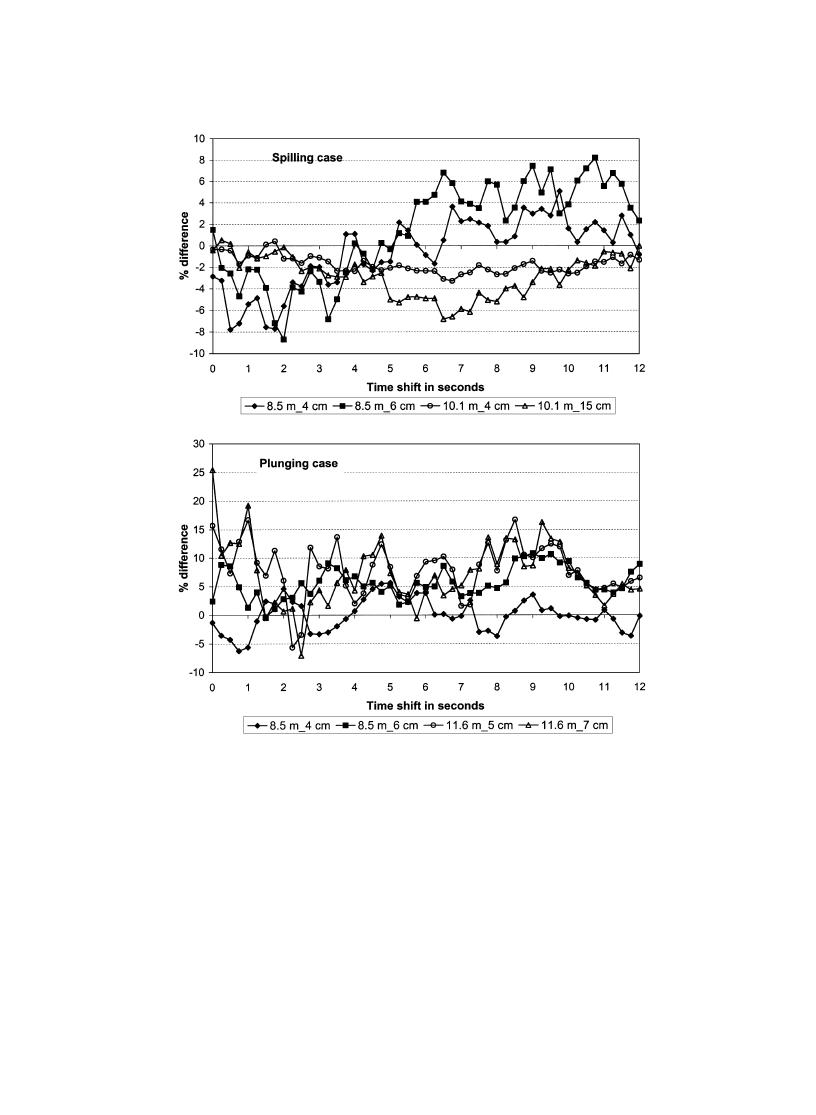
Fig. 23. Time averages of the ``shifted'' longshore flux in comparison with flux obtained from the product of time-averaged longshore current
and time-averaged concentration. Legends refer to distance from the shoreline and sensor elevation.
except at the plunging breaker line where less than
(Fig. 24, upper panel). While in the mid-surf zone, the
30% of the total longshore flux occurred within this
sediment-flux profiles were similar (Fig. 24, lower
portion of the water column. The shapes of sediment-
panel). The shapes of sediment-flux profiles resemble
flux profiles have been studied by Kraus and Dean
those of sediment concentration (Fig. 18), apparently
dominated by the much more drastic upward decrease
generalized empirical shape for the surf zone sedi-
of concentration, which overwhelmed the relatively
ment-flux profile was derived based on field data
slow upward increase of longshore current. At most
collected using streamer sediment traps (Kraus,
cross-shore locations, over 70% of the total longshore
1987; Wang, 1998). The profiles obtained in this
sediment flux occurred within 5 cm from the bed,

 Previous Page
