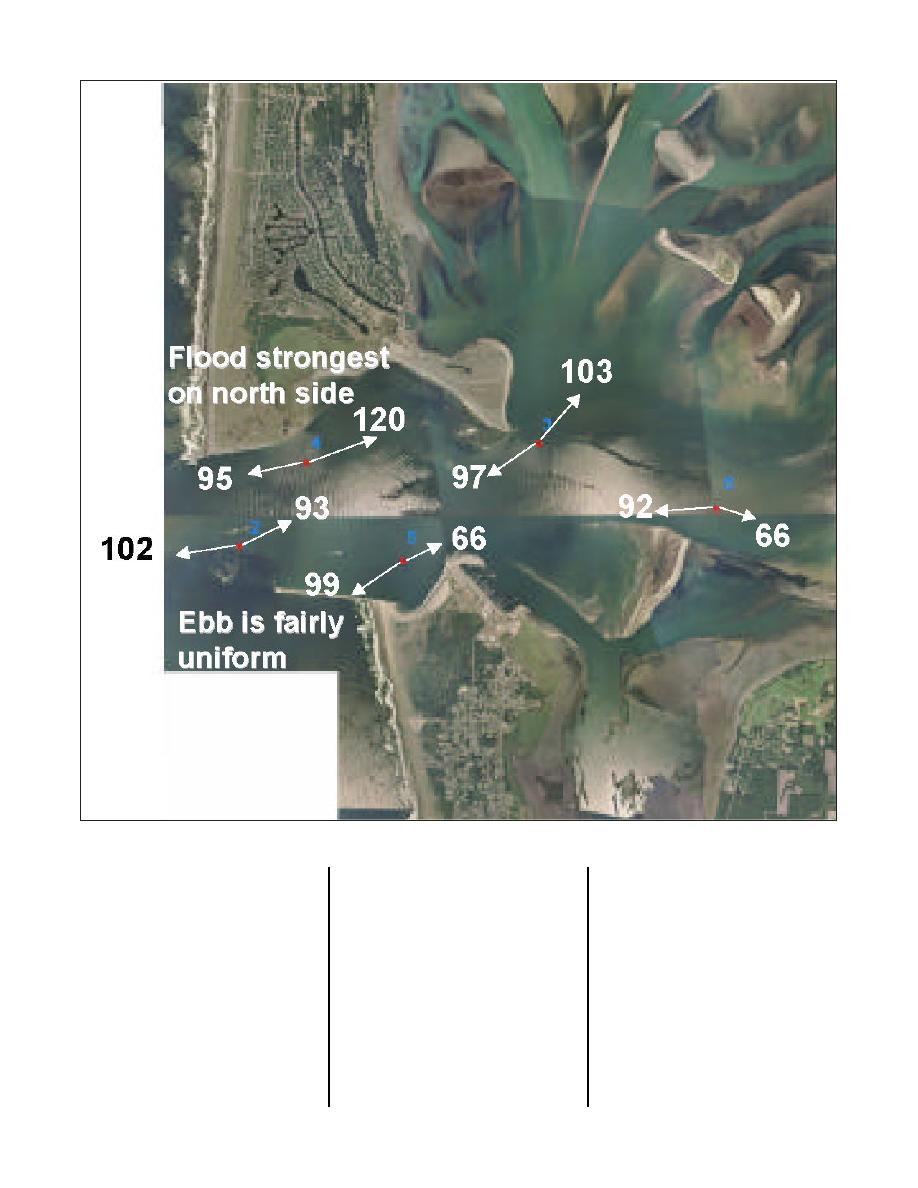
Figure 6. Average peak ebb and flood currents (cm/sec) for first month of field-data collection
Impacts of Currents
(stations 0 through 6 in Figure 1) to
1.2 m and at station 6 (most bay-
ward) does not exceed 0.4 m. All
the model results at these locations
and Water Level on
is given in Figure 8. Wave
stations show some evidence of tidal
influence, with the most predominant
attenuation from station 0, to station
Wave Transformation
2, to station 3, to station 6 is clearly
influence at the interior stations (sta-
tions 3 and 6). The difference
evident. The maximum wave height
Climatological conditions were
at stations 0 through 2 is over 4 m.
between measured and calculated
determined from the CDIP buoy data
Wave heights at stations 4 and 5 (in
wave height shows that model
(August 1993 through November
the inlet throat) do not exceed 2.8 m
results are typically within 0.5 m of
1999). The wave climate was
during this same time period. Wave
the measurements.
divided into 6 height, 5 period, and 6
height at station 3 does not exceed
significant angle bands to drive the
STWAVE model, for a total of 180
STWAVE simulations (Table 1).
Wave conditions were first run at
32


 Previous Page
