

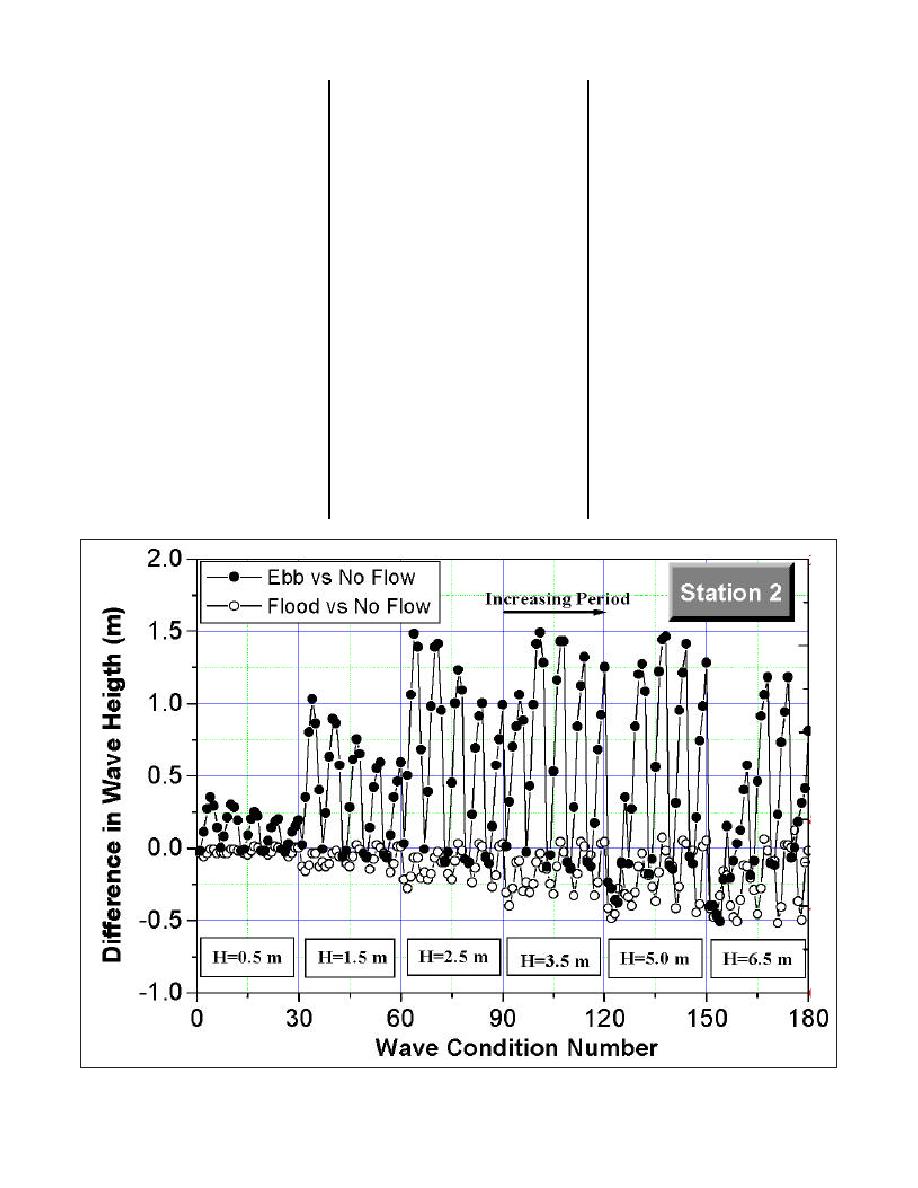
currents increase wave height at the
bathymetry redirecting flow offshore),
ADCIRC simulation and interpolated
seaward end of the entrance due to
but reduce wave height at stations 2
onto the STWAVE grid. Peak cur-
a local bathymetry-induced flow
and 3. Ebb currents cause a signifi-
rents, on the order of 0.8-0.9 m/sec,
reversal and reduce wave height
cant increase in wave height at all
were selected for a typical mean tide
(flatten waves) further inside the
stations for most wave conditions.
cycle and do not represent maxi-
inlet entrance. Water level has a
mum conditions that can occur at
minimal impact on waves in the inlet
Grays Harbor. (The maximum cur-
entrance, but does control wave
rent at the entrance during the first
Conclusions
transformation in the back bay.
deployment period was 1.7 m/sec.)
Examination of the effect of tidal cur-
The tide range was approximately
An extensive hydrodynamic study
rents on wave transformation and
2.1-2.2 m, which is equivalent to the
of Grays Harbor, WA was conducted
the modification of the current
mean tide range, whereas the spring
including data collection in fall 1999
through wave radiation stresses will
tide range is on the order of 3 m.
and numerical model simulations.
be examined in the next stage of
These simulations demonstrate the
The measurements show consider-
dynamic linking of models through
influence of water level and current
able wave attenuation through the
the CIRP steering module.
on waves in the Grays Harbor
inlet throat (factor of 10 decrease),
entrance. Figures 9 and 10 show dif-
flood currents strongest on the north
ferences in wave height at station 2
side of the inlet, and ebb currents
for the various currents and water
Acknowledgements
more uniformly distributed. The
levels versus wave heights with no
numerical models include wave and
current or water level variation.
This work was performed as part
tidal circulation simulations and the
Water level has minimal influence on
of a mission-support activity for the
effects of tidal currents and change
wave height in the inlet entrance
U.S. Army Engineer District, Seattle.
in water level on waves in an inlet
under most conditions. Flood cur-
Permission was granted by Head-
entrance. Ebb currents have the
rents increase wave height at sta-
quarters, USACE, to publish this
greatest influence and increase
tion 1 (due to the ebb shoal
information. The cooperation of
wave height 0.5-1.5 m. Flood
Figure 9. Influence of current on wave height. Each group of 30 wave conditions includes 5 wave periods and 6 wave
directions
35

 Previous Page
