

ERDC/CHL CHETN- IX-7
December 2001
8
0.500
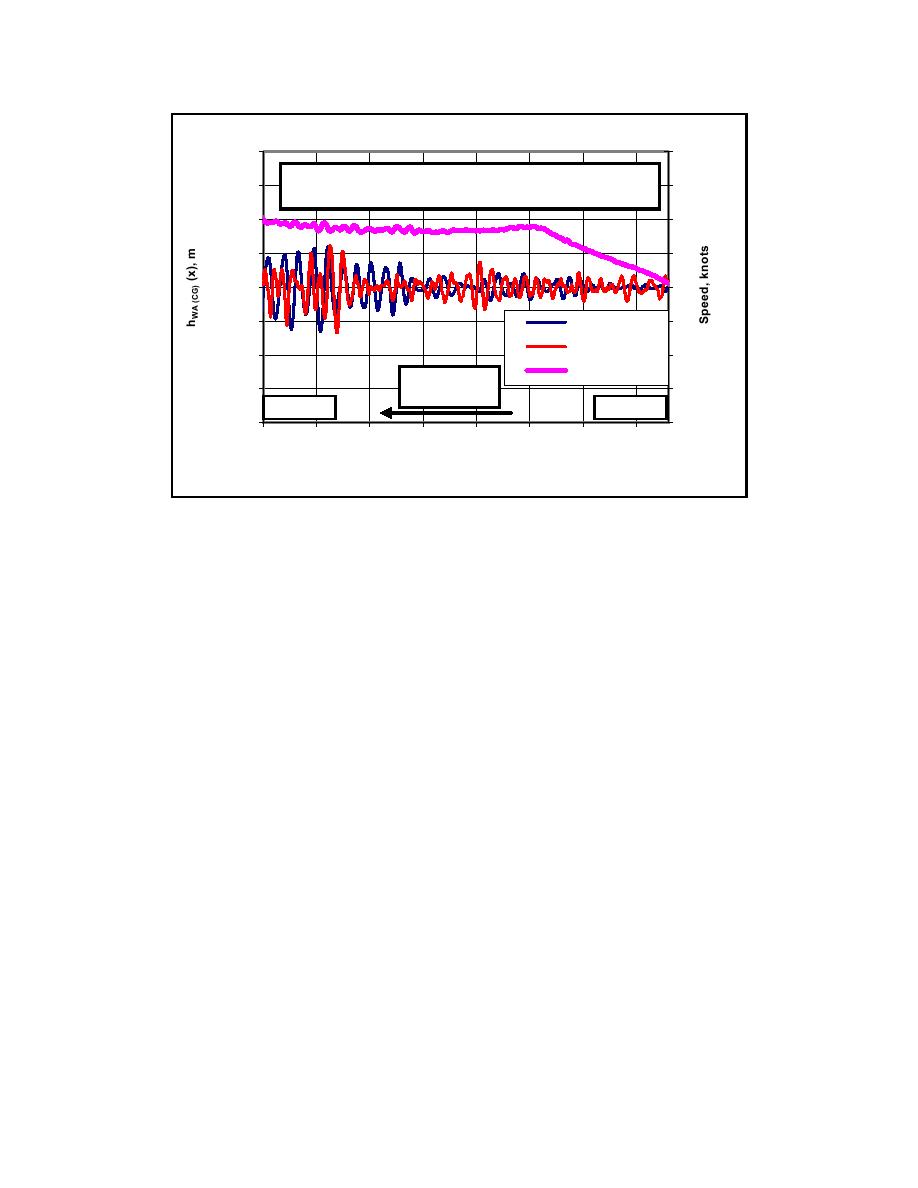
World Utility - Outbound - Full load (MAX draft) - 30 May 1999
7
0.375
Barbers Point Harbor, HI
6
0.250
5
0.125
4
0.000
3
-0.125
WU-field
WU-model
2
-0.250
Speed, WU-field
Ship Transit
1
-0.375
Direction
Offshore
Harbor
0
-0.500
0
500
1000
1500
2000
2500
3000
3500
Channel Station, ft
Figure 10. Measured field and laboratory hWA,CG(x) time series and field ship speed for
the outbound World Utility with full load (MAX draft)
Maximum Wave-Induced Vertical Motion: The maximum value (hWA,CG) of the hWA,CG (x)
time series for each of the eight field runs (i.e., four ships, inbound and outbound transits,
minimum and maximum drafts) is plotted versus channel station in Figure 11. This hWA,CG value
was selected as the largest wave-induced motion (i.e., largest negative value) from each of the
time series, with respect to the dockside static survey. The blue symbols represent the inbound
vessels and the red symbols the outbound vessels. For the data in Figure 10, the hWA,CG for the
field run is 0.17 m (0.55 ft) and occurs at channel Sta 550. The corresponding laboratory
maximum is slightly larger and occurs near Sta 700. The agreement is very good. Since waves
are largest at the offshore end of the channel, one would expect that the largest hWA,CG would
occur here. This figure shows that large values of hWA,CG can occur along the entire length of the
channel except near the shoreline where they have been reduced by wave transformation.
The comparison in Figure 10 is for just one of the laboratory runs for the outbound, fully-loaded
World Utility. How do the other six outbound runs for the two laboratory wave conditions (one
was lost due to low battery conditions) compare to the field value? Figure 12 shows the
variation of hWA,CG for these cases for the two laboratory wave conditions (i.e., DDU412 and
DDU422) as a function of ship speed. Ship speed was used in lieu of the nondimensional Fnh
because it is simpler to work with. The field measurement (i.e., the large closed circle) is shown
for reference. The match between the laboratory and field cases is very good. The slow-speed
cases are affected by the waves more than the high-speed cases since their hWA,CG values are
larger. A linear least squares fit of hWA,CG versus ship speed for these seven laboratory data has a
correlation coefficient of R2=0.71. The predicted hWA,CG at the field ship speed is 0.13 m,
underpredicting the measured hWA,CG = 0.17 m by 25 percent.
12

 Previous Page
