

ERDC/CHL CHETN- IX-7
December 2001
(INS)," Unpublished Technical Note, U.S. Army Engineer Research and Development Center,
Vicksburg, MS.
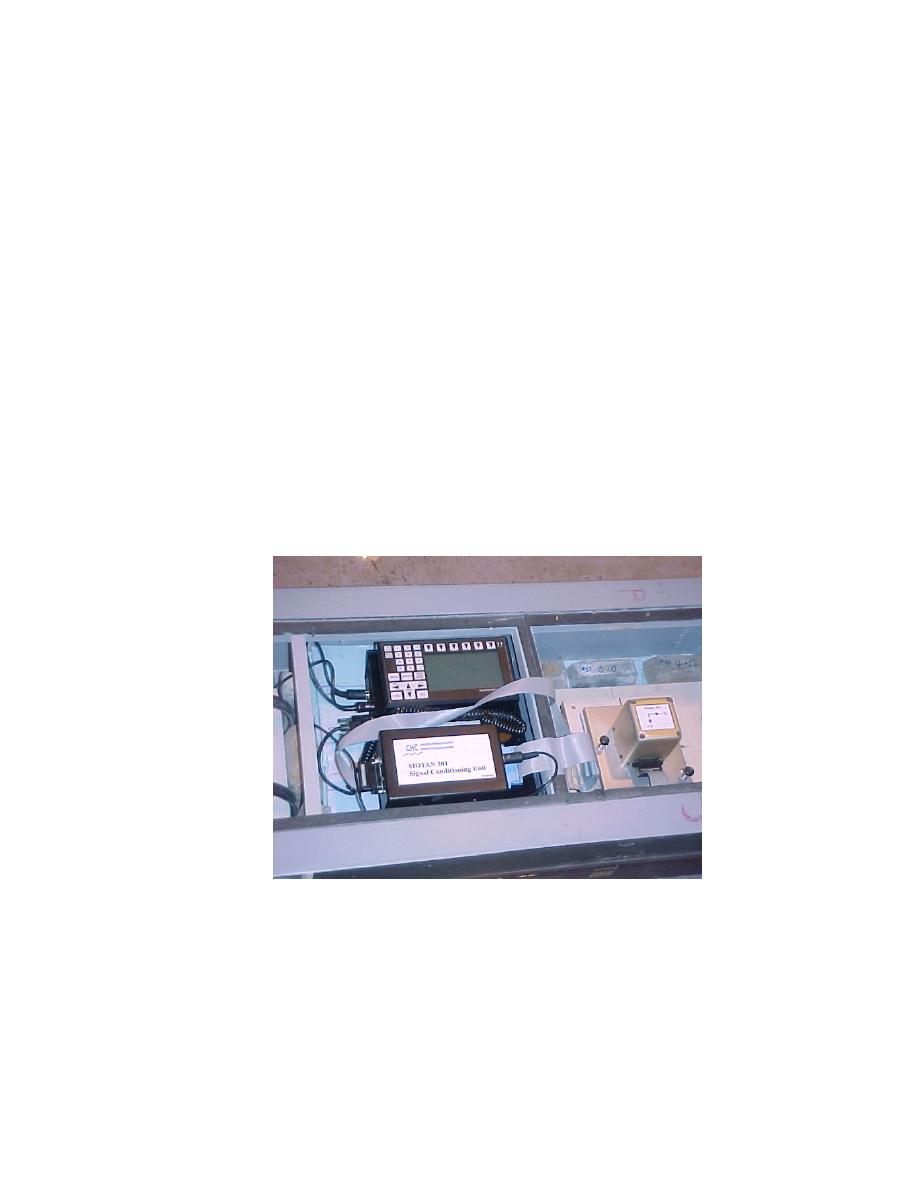
The MOTAN system was installed on the scaled World Utility vessel near the CG of the model
ship (Figure 7). The MOTAN Model 301 system (Miles and Pelletier 2000) was used, consisting
of a BEI MotionPak inertial motion sensor unit, a data acquisition system, a battery power unit,
and postprocessing software. The accuracy of the BEI MotionPak is 0.8 mm for data over a
minimum duration of 10 (regular waves) to 15 (irregular waves) times the encounter period.
Low and high frequency limits for data analysis are critical for accurate analysis. The low
frequency limit is required to prevent spurious low frequency motions due to sensor noise. The
high frequency limit is necessary to control high frequency noise in the computed accelerations
that depend on the derivatives of the measured angular rate signals. Values of 3 and 25 sec
(prototype scale) were used for these limits since they represent limiting wind wave periods for
wave-induced ship motions. The data acquisition system uses a data logger to record the analog
voltage signals from the six sensors. A sampling rate of 50 Hz was used to prevent aliasing of
high frequency noise since there are no input filters and the natural frequency of the rate sensors
is in the range of 15-20 Hz. Time synchronization with the wave-surface elevation data was
performed daily to insure accurate comparisons.
The MOTAN6 program computes
displacement, velocity, and acceleration for each of the 6 DOF responses at specified points on
the ship model.
Figure 7. MOTAN motion analysis system installed in the model
ship
Wave Conditions: Seven wave gages (Figure 8) were positioned in the model to obtain
significant wave heights. Four were located outside the channel and three were located on the
channel center line. One gage was used to calibrate the deepwater wave conditions at the 30-m
(100-ft) contour, and Gage 4 in the channel was positioned at the same relative location as the
field pressure gage at Sta 2200. Table 3 lists the gage x/y coordinates and water depth. The
7

 Previous Page
