

ERDC/CHL CHETN- IX-7
December 2001
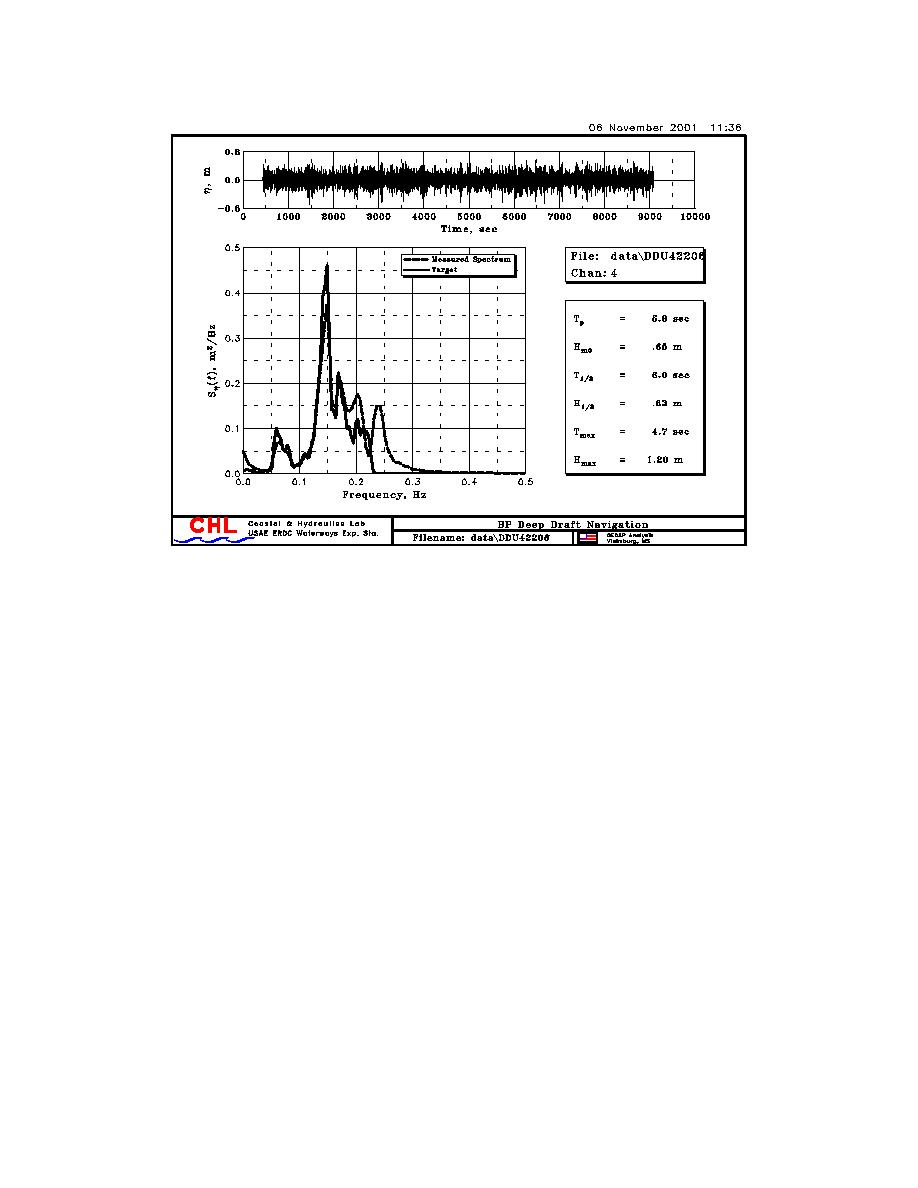
Figure 9. Target and laboratory wave case DDU422 for Tp = 6.7 sec and Hm0 = 0.58 m
FIELD AND LABORATORY WAVE-INDUCED VERTICAL MOTIONS
Time Series of Wave-Induced Vertical Motions: Time series of the wave-induced vertical
motions at the ship's CG as a function of channel location x (hWA,CG (x)) were measured for each
field transit and calculated for the laboratory runs. Figure 10 shows field and laboratory
hWA,CG (x) for the outbound run of the fully-loaded World Utility from the harbor Sta 3800 to the
offshore Sta 0. The blue line is the field measurements and the red line is the corresponding
laboratory data. The match is very good. The difference in phasing between the two time series
is insignificant as each is only one realization of an infinite ensemble of possible outcomes
because of the randomness of ocean waves. The important consideration is that both field and
laboratory values are the same order of magnitude and show the same trends within the entrance
channel.
The measured ship speed vship for the field data is also shown on the right-hand side of this plot.
It increases from a little over 4 knots to 6 knots as the ship leaves the entrance channel. The vship
for the model run was constant at about 4.2 knots. The depth-related Froude numbers Fnh (i.e.,
vship/(gh)0.5) for this range of ship speeds are in the subcritical range. Values are between 0.18 ≤
Fnh ≤ 0.28 for vship = 4 knots and 6 knots, respectively. The dimensionless Fnh is often used in
lieu of vship to describe ship motions.
11

 Previous Page
