

ERDC/CHL CHETN- IX-7
December 2001
Four of the field vessels had similar sizes and shapes, even though two were tankers. Therefore,
it is reasonable to compare the laboratory WU hWA,CG obtained for the range of wave conditions
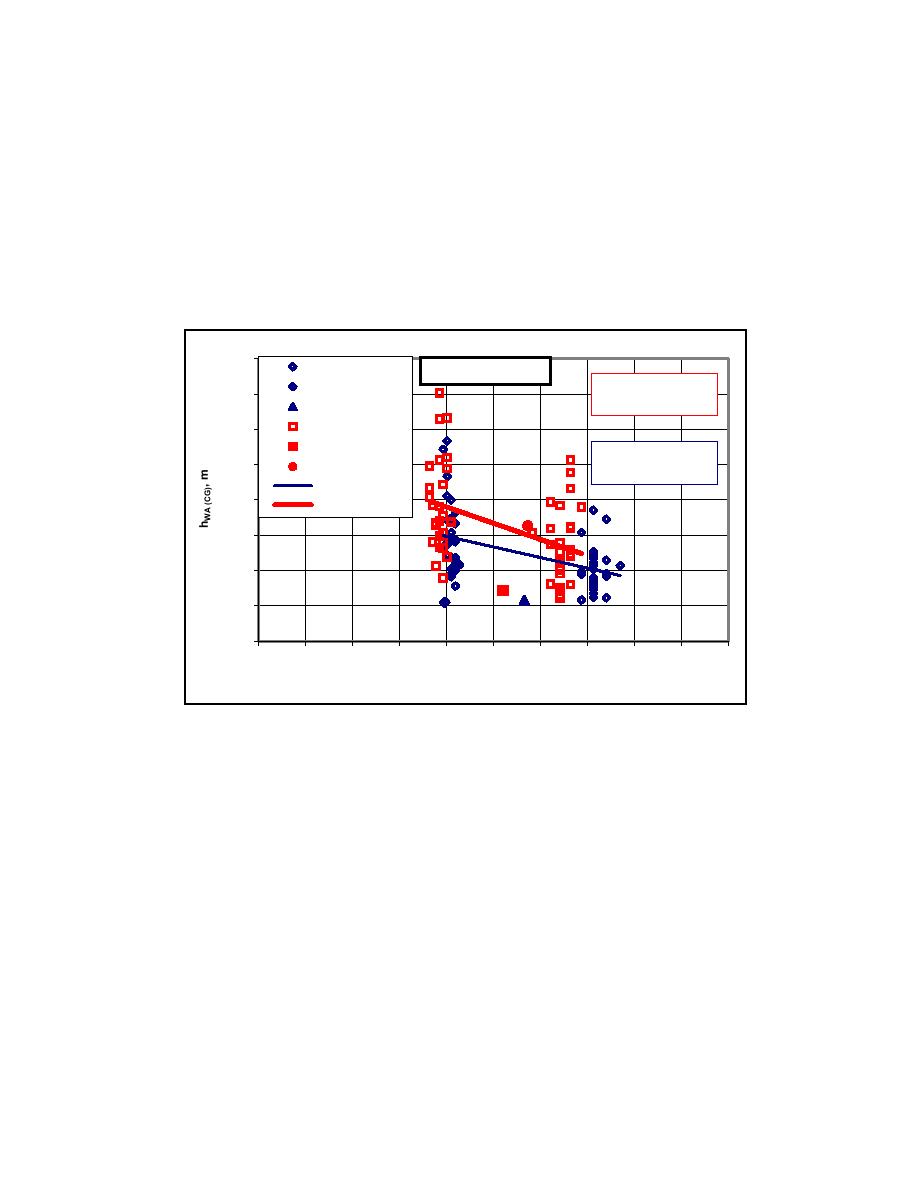
to the three other field hWA,CG values. Figure 13 shows the variation of the hWA,CG versus ship
speed for all the laboratory and field runs for southerly waves (i.e., 205 deg). Only fully-loaded
cases are included, with inbound runs in blue and outbound runs in red. Field values are shown
with larger symbols to improve readability. The hWA,CG from the other field ships are smaller
than the World Utility outbound run. They are, however, within the envelope of values measured
in the laboratory. In general, the laboratory hWA,CG are two to three times larger than the field
values. The magnitude of these differences is still very small, however.
0.40
Lab, IN
Full load (MAX draft)
y = -0.0229x + 0.2817
A, IN
0.35
2
R = 0.2052
PC, IN
Lab, OUT
0.30
CAH, OUT
y = -0.0149x + 0.2081
0.25
WU, OUT
2
R = 0.2351
Linear (Lab, IN)
0.20
Linear (Lab, OUT)
0.15
0.10
0.05
0.00
0
1
2
3
4
5
6
7
8
9
10
Speed, knots
Figure 13. Comparison of all field and laboratory hWA,CG for ships with full load (MAX
draft). Least squares linear fits for inbound and outbound ship transits are also shown
A linear least squares fit of the laboratory data is shown for both the inbound and outbound runs.
Although the R2 is very small for both inbound and outbound transits, it is very encouraging that
the magnitudes are of the same order and the differences are very small. The laboratory
outbound fit-line for hWA,CG lies between the two field points. The least squares fit for hWA,CG =
0.15 is now closer to the largest measured hWA,CG = 0.17 m from Figure 12. The predicted value
is now only 12 percent smaller than the measured field value for the outbound World Utility.
There are, however, many laboratory values that are larger than the measured field value. The
laboratory inbound fit-line for hWA,CG lies above the field points. Thus, except for this one point,
the laboratory data can be considered a conservative predictor of hWA,CG, as they are all larger
than the field values.
A possible explanation for some of this difference is the effect of directional spreading. The
field data were obtained in a directionally-spread wave environment, whereas the laboratory data
14

 Previous Page
