ERDC/CHL CHETN- IX-7
December 2001
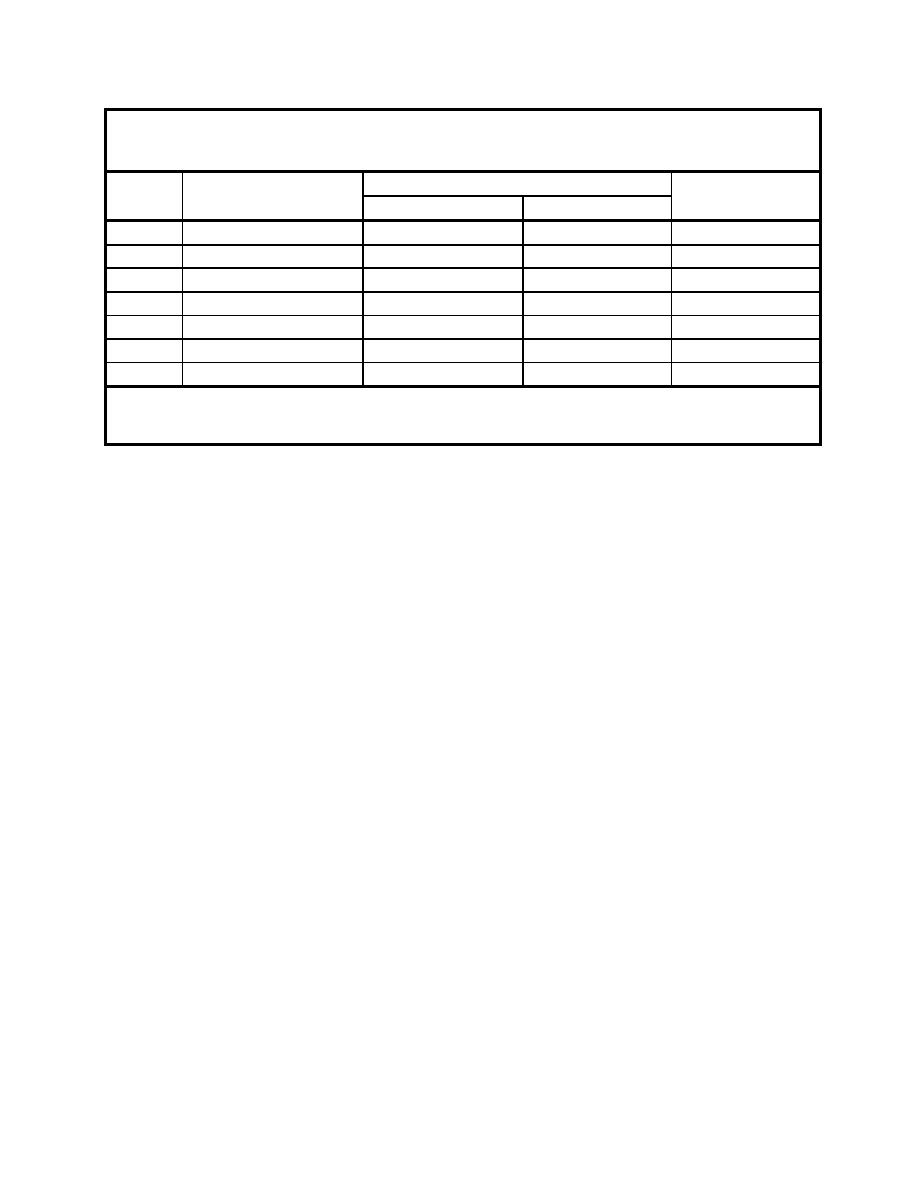
Table 3
Gages Coordinates and Water Depths Barbers Point Harbor, HI
Coordinates, m
Gage
Name
Water Depth, m
X
Y
W1
Incident-Toe
-166.2
-262.9
30.5
W2
Incident-East
391.8
-262.9
8.2
W3
Channel CL
96.7
0.0
12.8
W4
Channel CL
654.7
0.0
12.8
W5
Channel CL
894.3
0.0
12.8
W6
Incident-West
478.2
269.7
8.2
W7
Incident-East
654.7
-262.9
5.7
Notes:
1. Right-handed coordinate origin at channel Sta 0.00 and channel center line
2. Positive x-axis points toward harbor and positive y-axis toward west
Wave conditions were simulated in the laboratory based on the measured pressure gage data in
the channel. Although waves from the south (i.e., 205 deg) and west (i.e., 260 deg) were tested,
only the southerly waves are reported here since most of the observed directions during the field
measurements were for waves from the south. Most of the ship transits occurred between the
3-hr measurement times of the channel pressure gage. Therefore, to properly bracket all possible
wave conditions during the ship transit, the pressure gage data at the beginning and ending of
this 3-hr interval were both simulated. Thus, two wave conditions were created for each inbound
and outbound transit for each of the different ships. Because of pressure response factor and
signal to noise considerations, it was not possible to estimate the field wave conditions beyond a
0.23-Hz (2-Hz laboratory) cutoff. Waves for one of the ships, the Igrim, were not considered in
lab tests because this vessel is much smaller than the model ship used in the tests. Based on the
buoy data, it was decided to use the 19 May case for the missing 30 May transit pressure gage
data because the wave heights were similar.
Table 4 lists target and measured peak wave period Tp and significant wave height Hm0 for these
wave conditions at Gage 4. Figure 9 shows target and measured laboratory spectra for the sea-
dominant DDU422 wave case, corresponding to the outbound WU transit on 30 May 99. Most
of the target wave conditions were multimodal because of wave transformation in the entrance
channel due to wave shoaling, breaking, refraction, and diffraction. In many cases the energy in
these multiple peaks were nearly equal to each other. It was not possible to exactly reproduce
the slight variations in energy for every peak or mode. In some cases, the largest peak in the
measured spectrum was shifted from a sea to a swell peak, or vice versa. Although the
difference in measured Tp then appears to be large (in two cases DDU122 and DDU622), the
measured spectral shape actually matches the target spectrum reasonably well. Differences in
laboratory spectrum between 0.23 to 0.35 Hz (the field measurements were cut off at 0.23 Hz).
Because ship motions are not significantly affected by high frequency energy, it was not
necessary to correct the control signals any further.
9


 Previous Page
