

182
P. Wang et al. / Coastal Engineering 46 (2002) 175211
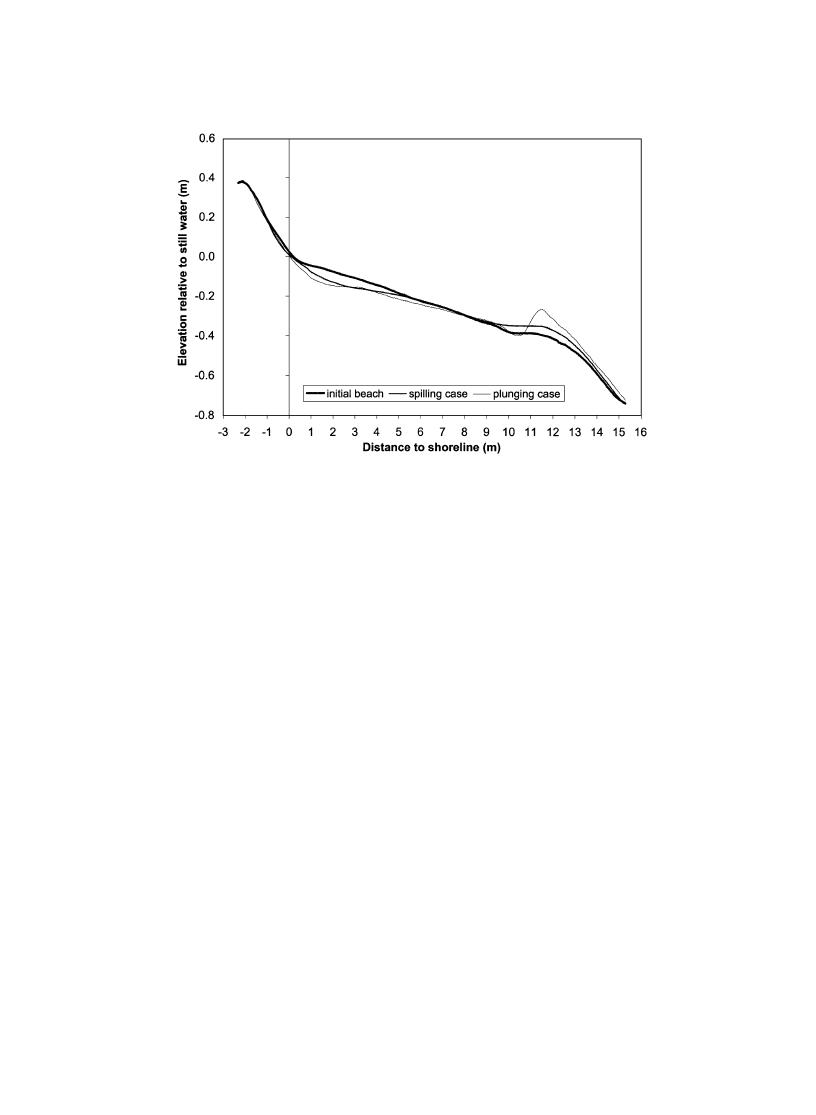
Fig. 4. Initial and equilibrium beach profiles for the two wave cases.
Although some variations were observed, particularly
final profile from the spilling waves as the initial
seaward of the breaker line, the ripple crests were
profile. The beach profile reached quasi-equilibrium
predominantly parallel to the shoreline.
after 6.3 h of the plunging-wave action. The plunging
For the convenience of discussion, the commonly
case was conducted in thirteen 40- to 100-min seg-
used nearshore zonation is defined as follows. The
ments. Considerable changes in profile shape were
swash zone ranged from the landward limit of uprush
measured for the plunging-breaker case, mainly at the
to the seaward extent of the planar bed, which roughly
plunging point, where a substantial breakpoint bar
coincides with the seaward limit of the backwash. For
developed (Fig. 4). The plunging profile shown in
the spilling case, the swash zone extended, on aver-
age, from 0.9 to 0.5 m. For the plunging case with
middle section of the test beach surveyed between 6.3
waves of longer period, the swash zone extended
and 10.5 h. Less change was observed in other parts of
from 1.1 to 0.9 m, about 43% wider than for the
the profile. Only the data collected after the equili-
spilling case (Fig. 5). The breaker zone, where main
brium between 6.3 and 10.5 h are discussed here. In
wave breaking occurred, ranged from 10 to 13 m for
the plunging case and 11 to 14 m for the spilling case.
direction) is positive seaward and is referenced to the
The bar crest was located at about 11.5 m for both
still-water shoreline of the initially constructed beach,
cases. The mid-surf zone lies between the swash and
which was designed to be located at 3 m from the
the breaker zones and ranged from 0.5 to 11 m for the
basin wall.
spilling case and 0.9 to 10 m for the plunging case.
Bed ripples developed over the entire surf zone
A greater wave setup, 1.3 vs. 1.0 cm, was measured
under the spilling breakers except in the vicinity of the
for the longer period waves of the plunging case than
shoreline (Fig. 5). Most of the ripples were 0.7 to 1.2
for the spilling case (Fig. 6). For the spilling case,
cm high with ripple lengths ranging from 6 to 10 cm
maximum setdown of 0.4 cm occurred at 10.1 m from
shoreline, slightly landward of the main breaker line
formed in the mid-surf zone, while in the vicinities of
identified from the trend of wave-height decay (Fig.
the breaker line and shoreline, a relatively featureless
2). For the plunging case, maximum setdown of 0.7
bed was observed. Most of the ripples were 1.0 to 1.5
cm occurred at 11.6 m, coinciding with the main
cm high with ripple lengths ranging from 8 to 12 cm.

 Previous Page
