Home
Download PDF
Order CD-ROM
Order in Print
Home
>
Coastal and Hydraulics Laboratory Fact Sheets
>
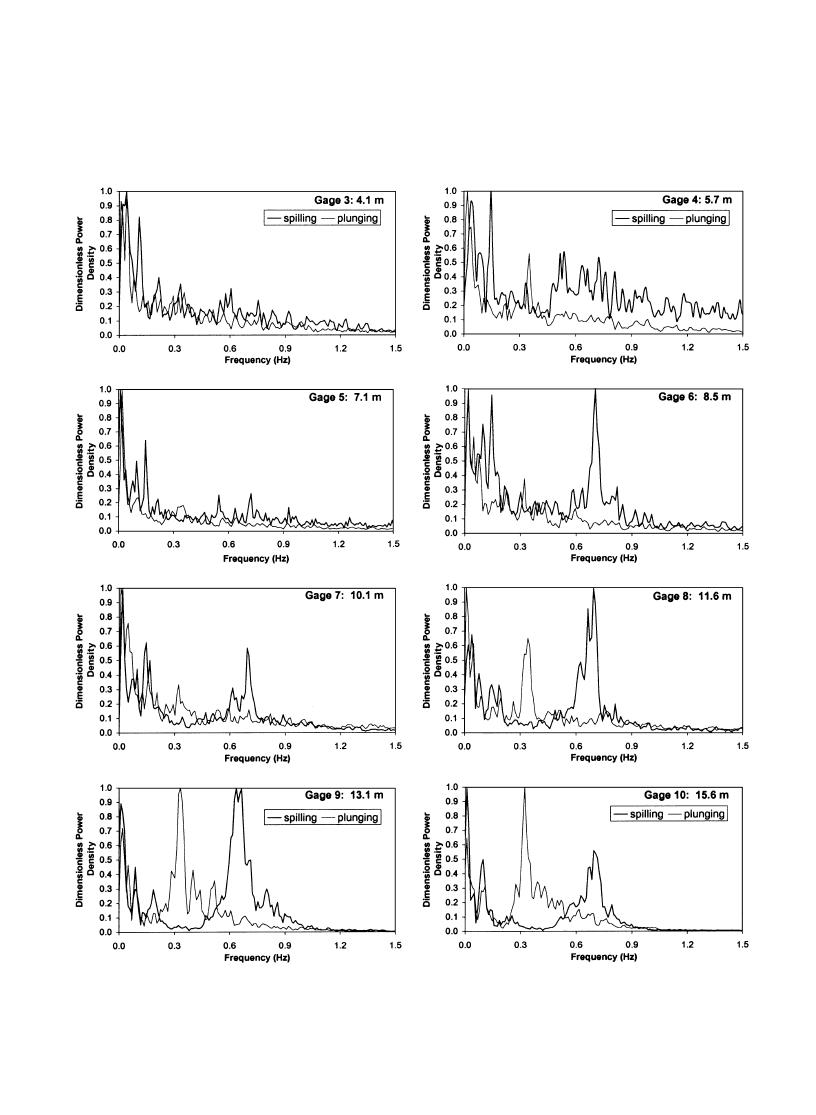
> Fig. 8. Spectra of the temporal variations of longshore current
Fig. 7. Spectra of the temporal variations of cross-shore current
Fig. 9. Time-series longshore current sampled at 20 Hz immediately landward of the main breaker line (at ADV6).
wang_ebersole_smith_johnson
Page Navigation
8
9
10
11
12
13
14
15
16
17
18
186
P.
Wang
et
al.
/
Coastal
Engineering
46 (2002)
175211
Fig.
8.
Spectra
of
the
temporal
variations of
longshore
current.


 Previous Page
