

P. Wang et al. / Coastal Engineering 46 (2002) 175211
185
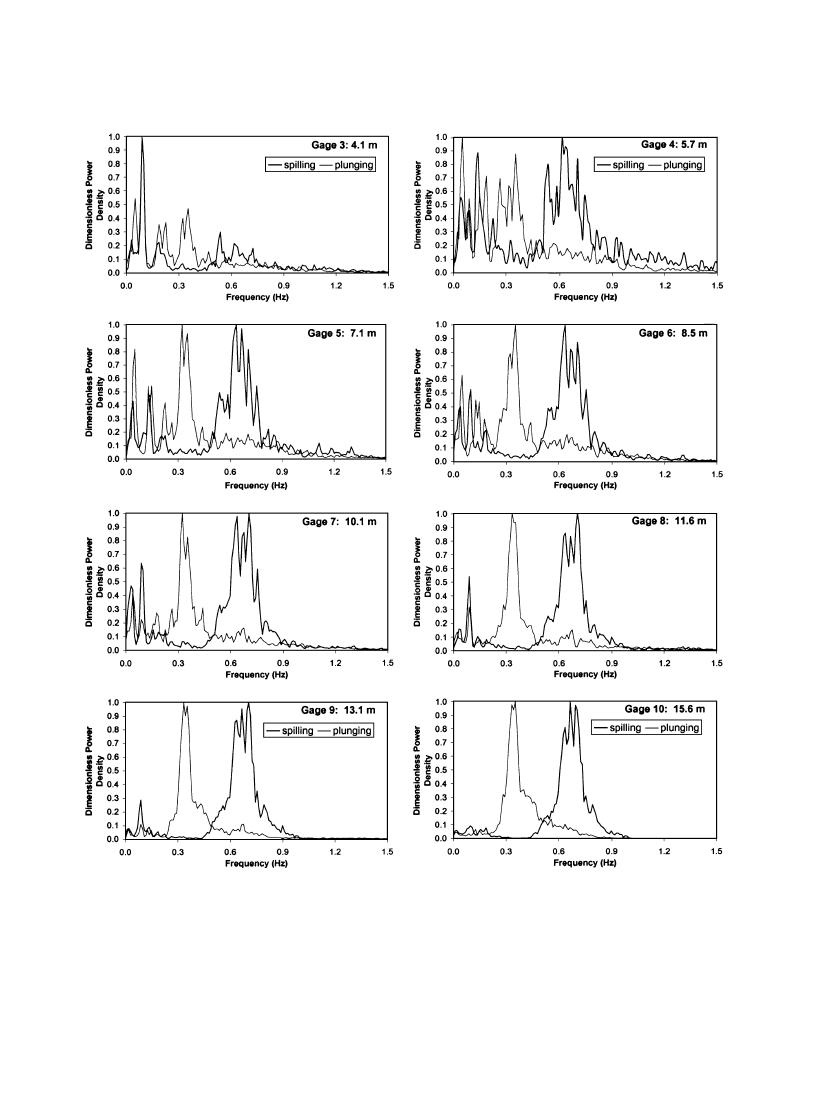
Fig. 7. Spectra of the temporal variations of cross-shore current.
shore current were relatively small in magnitude,
(top two panels). Examples from two elevations (1/3
and 2/3 of the still-water water depth from the bottom)
compared to the mean value (Fig. 9). The temporal
variation, as indicated by one standard deviation, was
at ADV6 location (8.5 m from shoreline), a short
44% of the mean value for the spilling case examples
distance landward of the breaker line, are illustrated.

 Previous Page
