Home
Download PDF
Order CD-ROM
Order in Print
Home
>
Coastal and Hydraulics Laboratory Fact Sheets
>
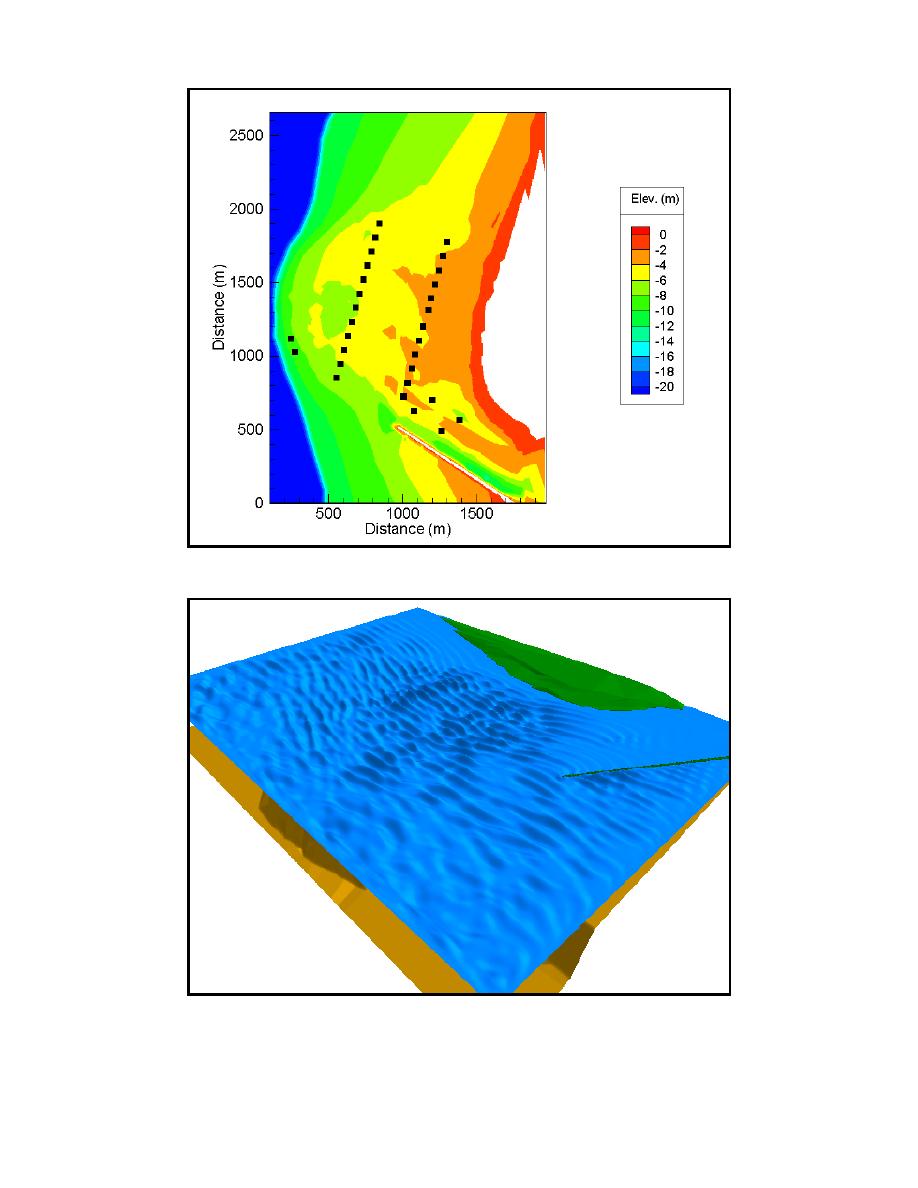
> Figure 30. Ponce de Leon Inlet model bathymetry
Figure 29. Predicted wave height distribution near inlet for test case with currents (Hmo = 0.055m, Tp = 1.4 s, U = 0.24 m/s)
Figure 32. 2-D map of wave height distribution predicted by Boussinesq model (Hmo = 0.95 m, Tp = 10 s, σθ = 20 deg)
BOUSS-2D
Page Navigation
52
53
54
55
56
57
58
59
60
61
62
Figure
30.
Ponce
de
Leon
Inlet
model
bathymetry
Figure
31.
3-D
view
of
multidirectional
wave
propagation
near
Ponce
de
Leon
Inlet
(
H
mo
=
0.95
m,
T
p
= 10 s,
σ
θ
= 20
deg)
57
Chapter
5
Model
Validation


 Previous Page
