

6
4
2
0
0.4 m/s
-2
-6
-4
-2
0
2
4
6
x (m)
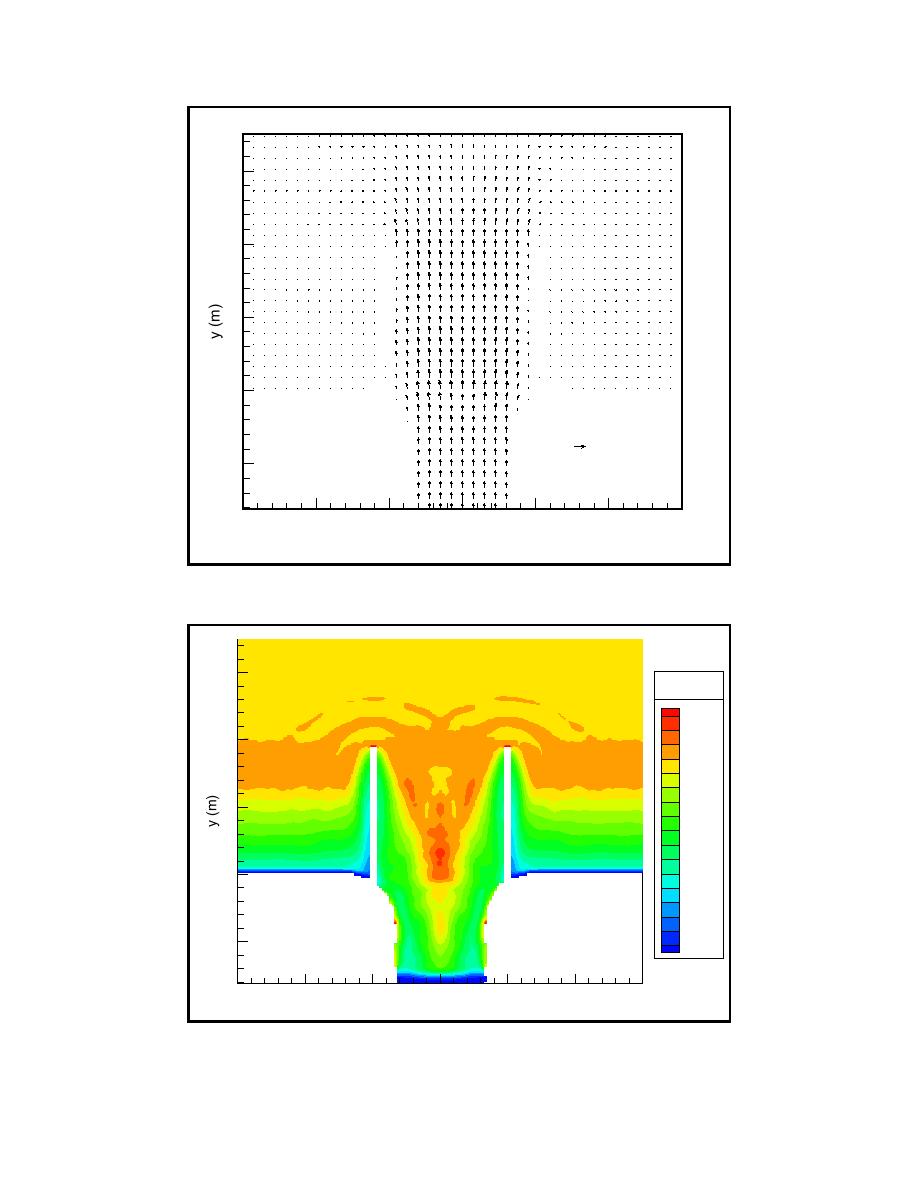
Figure 27. Predicted current field for U = 0.24 m/s
6
Hmo (m)
0.069
0.065
4
0.061
0.057
0.053
0.049
0.045
2
0.041
0.037
0.033
0.029
0
0.025
0.021
0.017
0.013
0.009
-2
0.005
-6
-4
-2
0
2
4
6
x (m)
Figure 28. Predicted wave height distribution near inlet for test case without
55
Chapter 5 Model Validation

 Previous Page
