

6
Hmo (m)
0.075
0.07
4
0.065
0.06
0.055
0.05
0.045
2
0.04
0.035
0.03
0.025
0
0.02
0.015
0.01
0.005
0
-2
-6
-4
-2
0
2
4
6
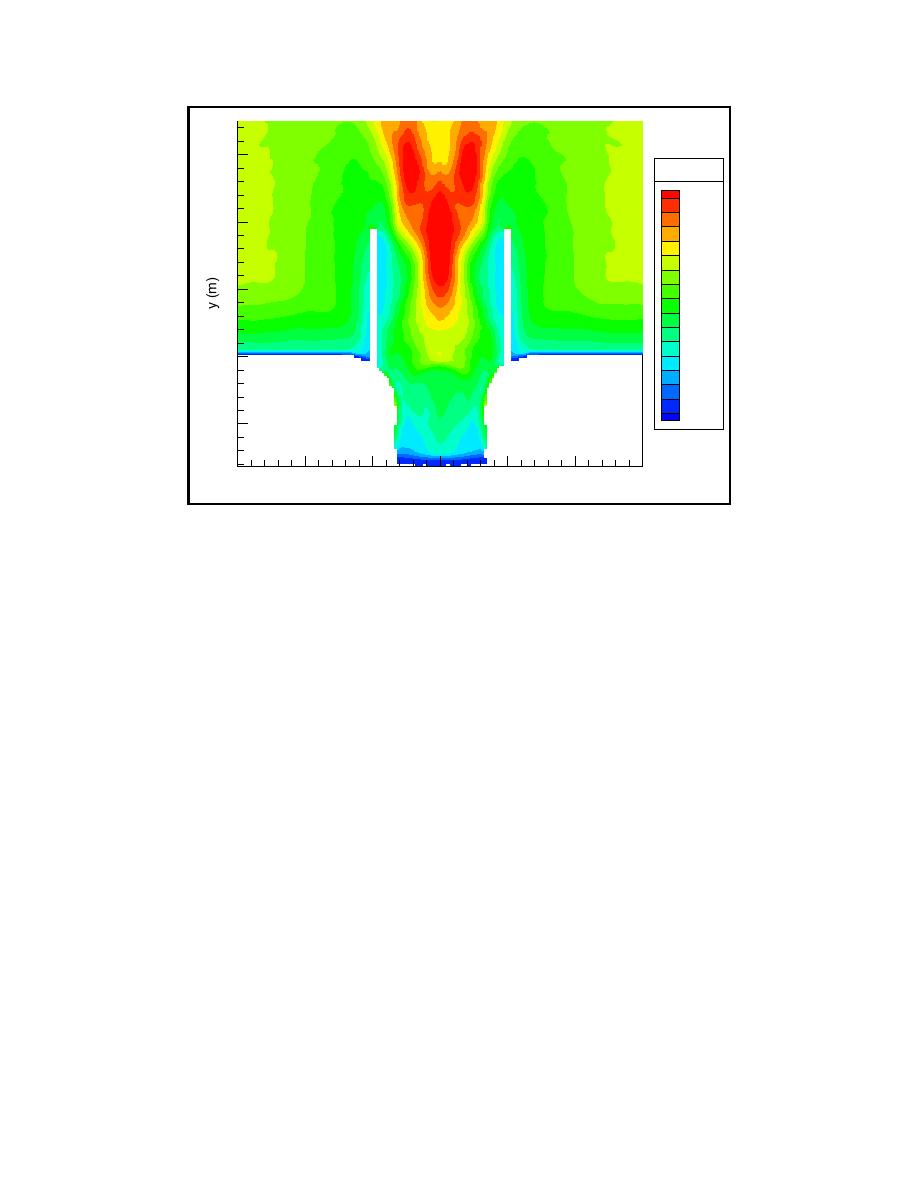
x (m)
Figure 29. Predicted wave height distribution near inlet for test case with
was used for the directional spreading function. Water-surface elevation data
were recorded at 30 locations.
BOUSS-2D was run for one of the multidirectional test cases characterized
by Hmo = 0.95 m, Tp = 10 s, γ = 5, and directional spread σθ = 20 deg (Test
No. 11). The bathymetry used for the numerical simulations is shown in Fig-
ure 30. Boussinesq model simulations were carried out using ∆x = ∆y = 5 m and
∆t = 0.15 s. Time-histories of the velocity boundary conditions along the wave-
maker were synthesized using the double-summation method for a duration of
500 s, corresponding to 50 wave periods.
A snapshot of the instantaneous water-surface elevation produced by the
BOUSS-2D model is shown in Figure 31. The corresponding significant wave
height distribution is shown in Figure 32. Two distinct wave-focusing regions
can be observed on the shoal. The predicted wave height variations along the
offshore and nearshore gauge arrays are compared to the experimental results in
Figures 33 and 34, respectively. BOUSS-2D reasonably reproduced the wave
height variation along the offshore array, although differences of the order of
20 percent exist at a couple of gauge locations. For the nearshore array, excellent
agreement is obtained between BOUSS-2D model predictions and the experi-
mental data.
56
Chapter 5 Model Validation

 Previous Page
