710
Stauble and Tabar
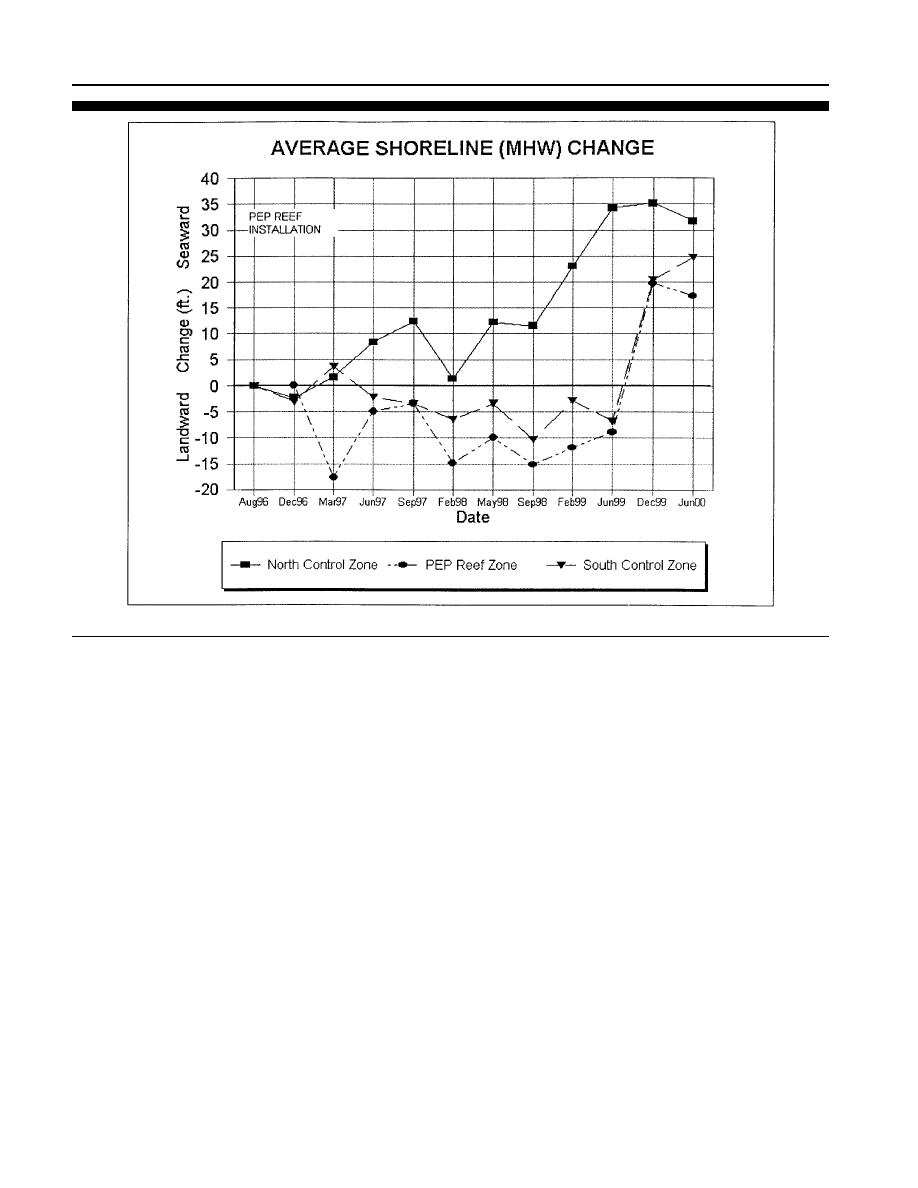
Figure 24. Cumulative shoreline change at Vero Beach P.E.P. Reef installation (Stauble, 2002).
P.E.P. Reef zone and a mixed sometimes landward and some-
ft) was also in the seaward direction, due to the large accre-
times seaward movement in the south control zone persisted
tion in the last measuring period. The north control zone
from installation to June 1999 (STAUBLE 2002).
showed a slight landward movement from December 1999 to
Reflecting a large post-storm gain in sand on the subaerial
June 2000. However, the cumulative overall project average
beach, the shoreline over the entire project length moved sea-
(August 1996 to June 2000) was still the largest seaward
ward as of the December 1999 survey. Over the cumulative
movement, measuring 9.7 m (31.7 ft). This cumulative shore-
August 1996 to December 1999 (forty-month) period, the av-
line movement is due to the almost constant seaward move-
erage seaward movement of the MHW shoreline reflected a
ment of the shoreline in this zone for the other periods.
gain in sand on the berm at all profile locations. The cumu-
lative shoreline position landward of the P.E.P. Reef moved
Sediment Volume Response
seaward an average of 6.0 m (19.8 ft), showing the first sea-
ward movement in the shoreline since installation. The
Cumulative volume change over the August 1996 to June
shoreline in the north control zone also averaged a large 10.7
1999 period (characterized the general project response) for
m (35.1 ft) seaward movement and south control zone aver-
the north control zone experienced accretion averaging 45.98
aged a relatively large move of 6.2 m (20.4 ft) seaward.
cu m/m (18.32 cu yd/ft). In the vicinity of the P.E.P. Reef,
volume change showed erosion averaging 7.81 cu m/m
Due to lack of storm activity between December 1999 and
( 3.11 cu yd/ft) length of beach. The south control averaged
June 2000 (over the winter and spring), the shoreline contin-
a loss of 5.95 cu m/m ( 2.37 cu yd/ft).
ued to average an overall seaward movement trend for the
entire project length. Most of the seaward movement this
The volume change analysis comparing the baseline Au-
time was in the south control zone. An average cumulative
gust 1996 survey to the post-storm December 1999 survey
seaward shoreline change of 7.6 m (24.9 ft) was measured
showed the same trends in sand accretion as was measured
over the entire study period from August 1996 to June 2000
in the shoreline seaward movement (Figure 25). In the P.E.P.
in the south control zone. Within the P.E.P. Reef zone, the
Reef zone, the beach volume change experienced accretion of
average overall project cumulative movement of 5.3 m (17.4
11.70 cu m/m (4.66 cu yd/ft). The south control experienced a
Journal of Coastal Research, Vol. 19, No. 3, 2003


 Previous Page
