Submerged Narrow-Crested Breakwaters
691
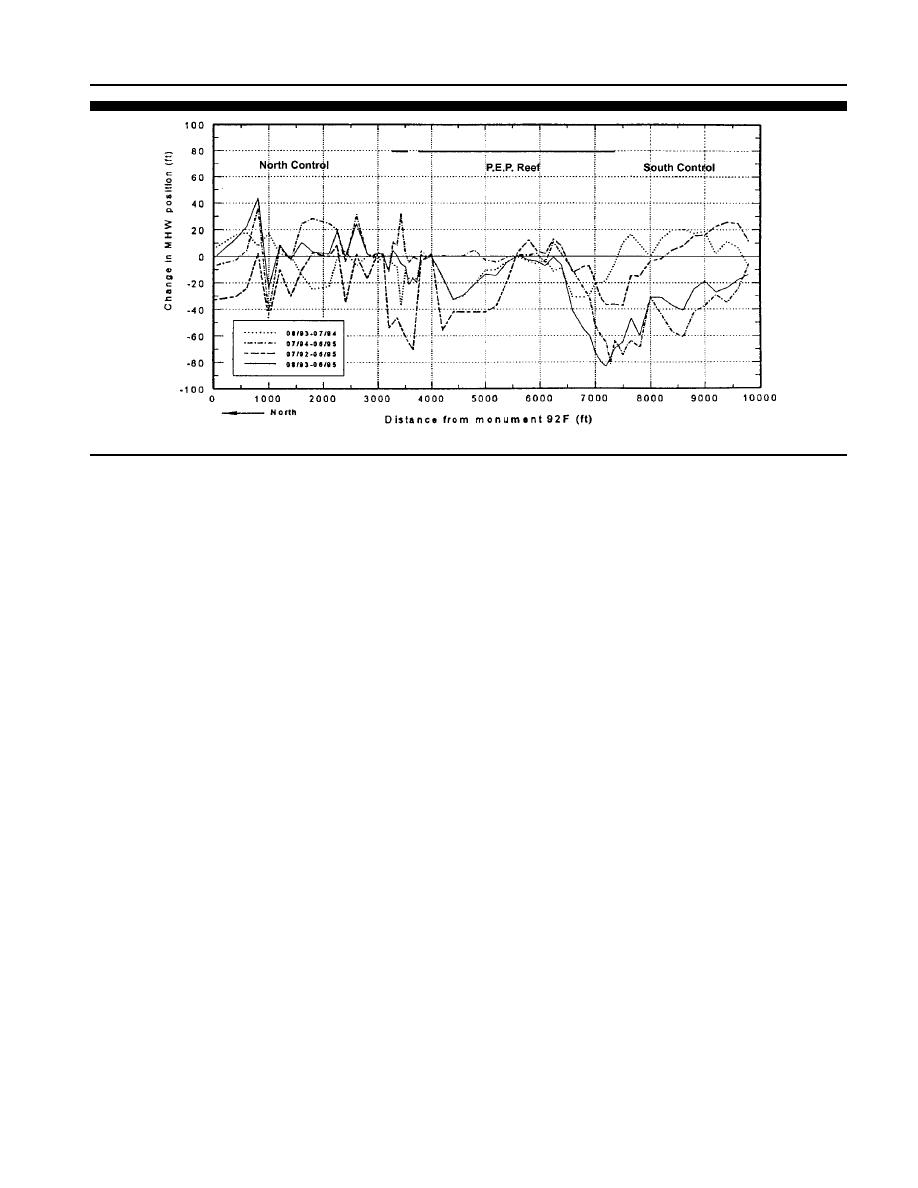
Figure 7. Comparison of the annual shoreline changes at Midtown Palm Beach, Florida (after Dean and Chen, 1996).
in sand volume (Figure 9). In plan view, this cumulative
recession (DEAN and CHEN, 1995c). Since this area was
change is illustrated in Figure 10, with the greatest loss in
backed by seawalls or rock revetments over 80% of the shore-
the lee of the reef structure over the thirty-five month mon-
line length, the landward movement was stopped when the
itoring. Up to 1.52 m (5.0 ft) of sand was removed with a
shoreline retreated to the shore protection structures. The
shoreline recession of around 7.9 m (26 ft) behind the reef
largest recession was measured in the area at the south end
and to the south of the reef. The only areas of gain in sand
of the P.E.P. Reef and the northern south control area. This
of greater than 0.31 m (1.0 ft) were measured on the beach
area showed an average net recession of 18.7 m (61.2 ft).
and in the offshore of the north control zone and in the near-
There was initial shoreline advancement in this south area
shore south control zone. DEAN and CHEN (1995c) provided
up until March 1994, but since that time the shoreline has
receded. The overall average shoreline change in the south
representative profiles to show the volume changes in each
control area was a slight seaward movement of 0.20 m (0.66
zone. A representative profile from the north control (R-94D)
shown on Figure 10 as A-A , is located approximately 457 m
ft). Within the zones, the highest long-term shoreline retreat
was measured in the P.E.P. Reef area.
(1,500 ft) north of the P.E.P. Reef and is backed by a seawall.
Figure 11a shows that there was a slight gain in sand over
Sediment Volume Response
time at that location. Profile R-96F (shown on Figure 10 as
line B-B ), located approximately 304.8 m (1000 ft) south of
The volume change was measured as the difference be-
the north end of the P.E.P. Reef shows the representative
tween beach profile surveys at each profile line. The volume
sand elevation losses of around 72.5 cu m/m (28.9 cu yd/ft)
change results were similar to the shoreline change. The
experienced behind the P.E.P. Reef (Figure 11b). Most of the
north control area experienced both erosion and accretion
loss was between the seawall base and the P.E.P. Reef unit.
over the monitoring period. Erosion has been measured in the
Changes in the south control zone are represented by profile
lee of the P.E.P. Reef and just to the south of the reef zone.
line R-100B (shown as line C-C on Figure 10), which is ap-
DEAN and CHEN (1995c) reported that from August 1993 (af-
proximately 304.8 m (1,000 ft) south of the P.E.P. Reef. This
ter the installation of the entire reef) to June 1995 erosion
area, also backed by a seawall, gained sand from July 1992
was measured as 141.6 cu m/m (56.4 cu yd/ft) between the
to August 1993 and continued till July 1994 (DEAN and
seawalls and the P.E.P. Reef (Figure 8). Seaward of the reef
CHEN, 1995c), but experienced erosion form July 1994 to
structure, volume changes were mixed over the monitoring
June 1995 (Figure 11c) with a net loss of about 76.8 cu m/m
period but were of much less magnitude than landward of
(30.6 cu yd/ft) relative to the pre-installation July 1992 sur-
the reef.
vey.
Cumulative changes in volume by zone over the monitoring
period showed that the north control zone exhibited only a
Settlement
minimal loss in sand. The area behind the reef structure had
a trend for loss, which totaled 81,736 cu m (106,900 cu yd)
The 57 units installed in August 1992 have settled an av-
from pre-installation survey of July 1992 to final survey of
erage of 0.84 m (2.74 ft) over the 34 months of monitoring in
June 1995 (DEAN and CHEN, 1995c). The south control zone
June 1995. The 273 units placed in August 1993 have settled
experienced accretion until July 1994, and then showed a loss
on average 0.60 m (1.98 ft) over 22 months of monitoring
Journal of Coastal Research, Vol. 19, No. 3, 2003


 Previous Page
