

Executive Summary
The Navy subsequently prepared two EAs as tiered analyses to the EIS due to subsequent changes in the
location of beach receiver sites. These two EAs are Environmental Assessment for Be a c h
Replenishment at South Oceanside and Cardiff/Solana Beach, California (Department of the Navy
1997a) and Environmental Assessment for Beach Replenishment at North Carlsbad, South Carlsbad,
Encinitas, and Torrey Pines (Department of the Navy 1997b). As a result of the Homeporting project
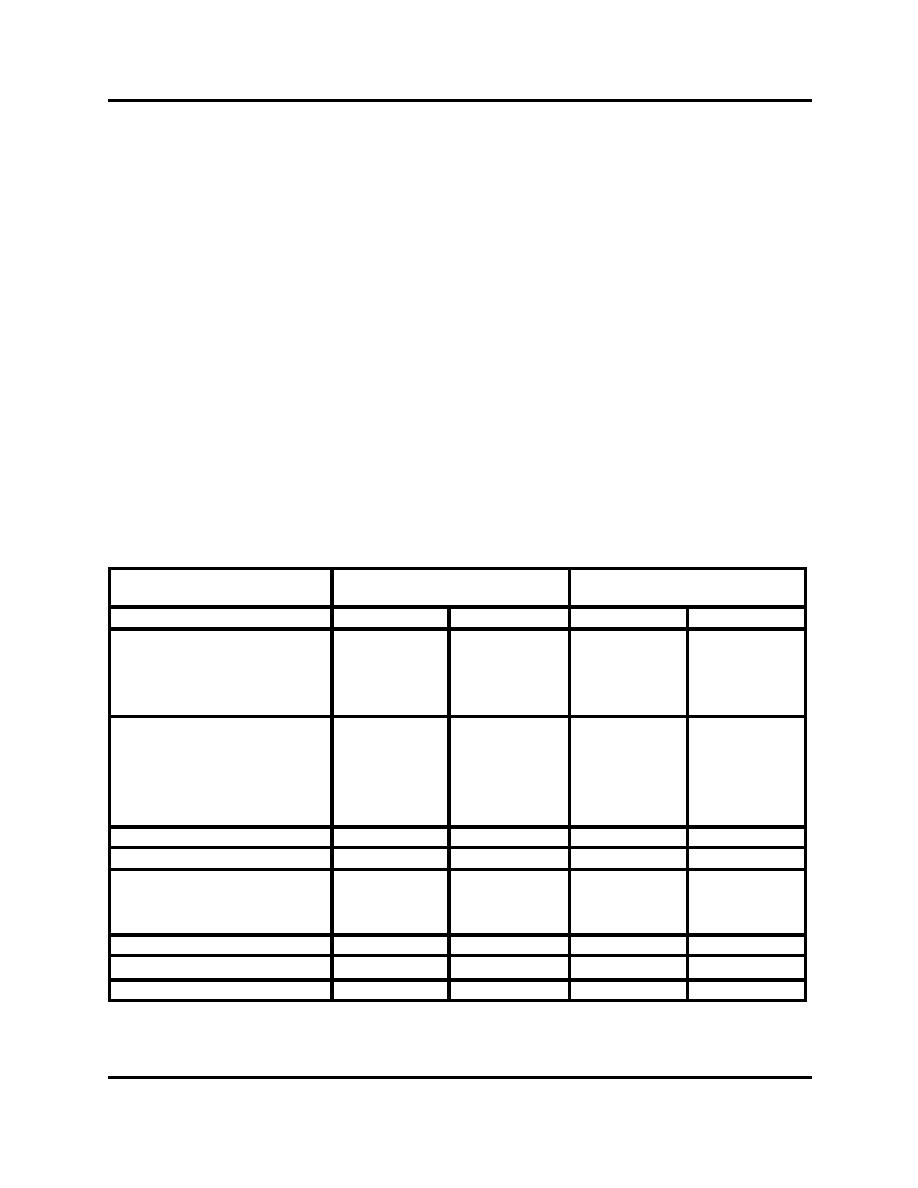
and subsequent EAs, permits were issued to the Navy to place approximately 5.5 million cy of sand
dredged from San Diego Bay, both onshore and nearshore, at 11 receiver sites along the San Diego region
coastline (Table ES-1). During beach replenishment in Oceanside, however, munitions were found in the
dredged materials from San Diego Bay and beach replenishment efforts were halted. Prior to the halting
of the beach replenishment disposal, approximately 284,000 cy of sediment were placed on three receiver
sites; specifically, Oceanside, Del Mar, and Mission Beach. Oceanside received 102,000 cy (onshore),
Del Mar received 170,000 cy (nearshore), and Mission Beach received 12,000 cy (nearshore).
Table ES-1
Comparison of Sand Replenishment for
Navy Homeporting Project and San Diego Regional Beach Sand Project
Homeporting Project
Regional Beach Sand Project(1)
Receiver site
(cubic yards)
(cubic yards)
Oceanside
Onshore
1,044,298
Onshore
380,000
Carlsbad
North Carlsbad
Onshore
445,526
Onshore
240,000
South Carlsbad, North
Onshore
251,164
Onshore
160,000
South Carlsbad, South
Onshore
503,080
Onshore
0
Encinitas
Batiquitos
0
Onshore
118,000
Leucadia
0
Onshore
130,000
Moonlight Beach
0
Onshore
88,000
Cardiff
Onshore
283,501
Onshore
104,000
Solana Beach
Onshore
178,227
Onshore
140,000
Del Mar
Nearshore
450,027
Onshore
180,000
Torrey Pines
Torrey Pines North
Onshore
296,172
Onshore
0
Torrey Pines South
Onshore
230,359
Onshore
240,000
Mission Beach
Nearshore
860,051
Onshore
100,000
Imperial Beach
Nearshore
915,665
Onshore
120,000
Total
5,458,070
2,000,000(1)
Reflects quantity of sand based on Alternative 1. One other alternative analyzed in detail in this EIR/EA
(1)
would result in a maximum of 2.04 million cy of sand to be replenished with fewer receiver sites and a greater
amount of material at some remaining sites.
Page ES-2
Regional Beach Sand Project EIR/EA
99-69\SANDAG EIREA es.wpd 7/17/00

 Previous Page
