ERDC/CHL CHETN-IV-61
December 2003
1
0.8
Full shoreline response, S/L> 0.4
0.6
0.4
Partial shoreline response
S/L<0.40
0.2
0
Bakers
Siuslaw River-
Siuslaw River-
Shark River
Fort Pierce
Haulover
north
south
0.58
0.42
0.27
0.18
0.13
S/L
1
1
0.35
0.27
0.16
Response
S/L
Response
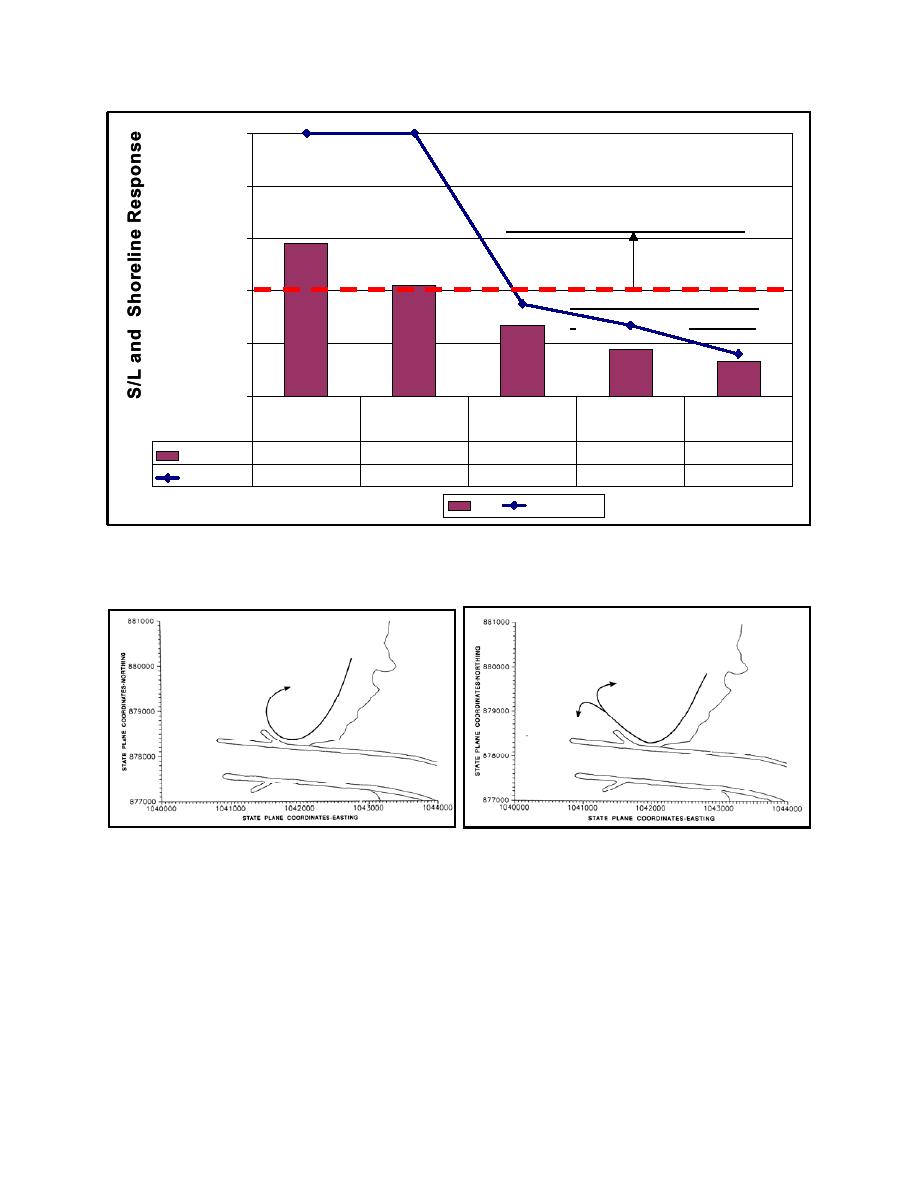
Figure 8. Spur length (S) to distance from spur to local average shoreline (L) ratio plotted with shoreline
response, which is ratio of (a) distance from local average shoreline to immediate shoreline at jetty to
(b) distance from local average shoreline to spur
a. High tide
b. Low tide
Figure 9. Currents deflected by Siuslaw River jetty spurs (from Pollock et al. 1995)
A pilot study of spurs was initiated in the Coastal Inlet Research Program physical inlet model.
The physical model facility (Seabergh 1999) is a large experimental basin (46 m wide by 99 m
long) with an idealized inlet and smooth offshore contours (Figure 10). Short-period waves and
tidal currents can be simulated in this facility. A scale of 1:50 is applied to this generic inlet
configuration. Twin parallel jetties were placed at the inlet entrance, with three spur conditions
examined. Wave height, wave period, and tidal current were varied to produce different surf and
alongshore-current conditions. Experiments included measurement of wave height, measurement
ters, and examination of sediment pathways with a lightweight sediment tracer. Initial or base
9


 Previous Page
