Home
Download PDF
Order CD-ROM
Order in Print
Home
>
Coastal and Hydraulics Laboratory Fact Sheets
>
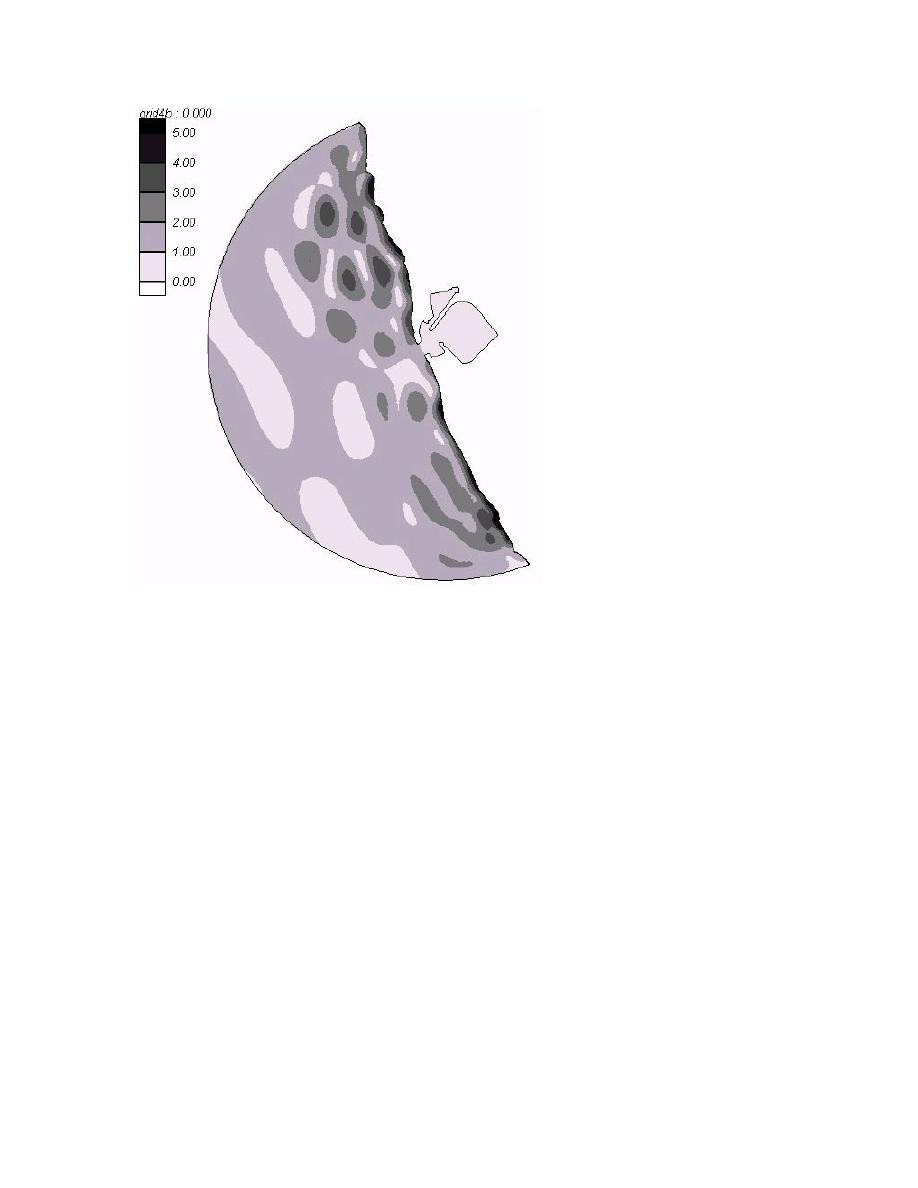
> Figure 28. Estimated wave height diagram for normal incident direction, 100-second period wave condition
Figure 27. Wave phase diagram for normal incident direction, 100-second period wave condition
Onslo Bay, NC
cgwave_man3
Page Navigation
101
102
103
104
105
106
107
108
109
110
111
Figure
28.
Estimated
wave
height
diagram
for
normal
incident
direction,
100-second
period
wave
condition
105


 Previous Page
