

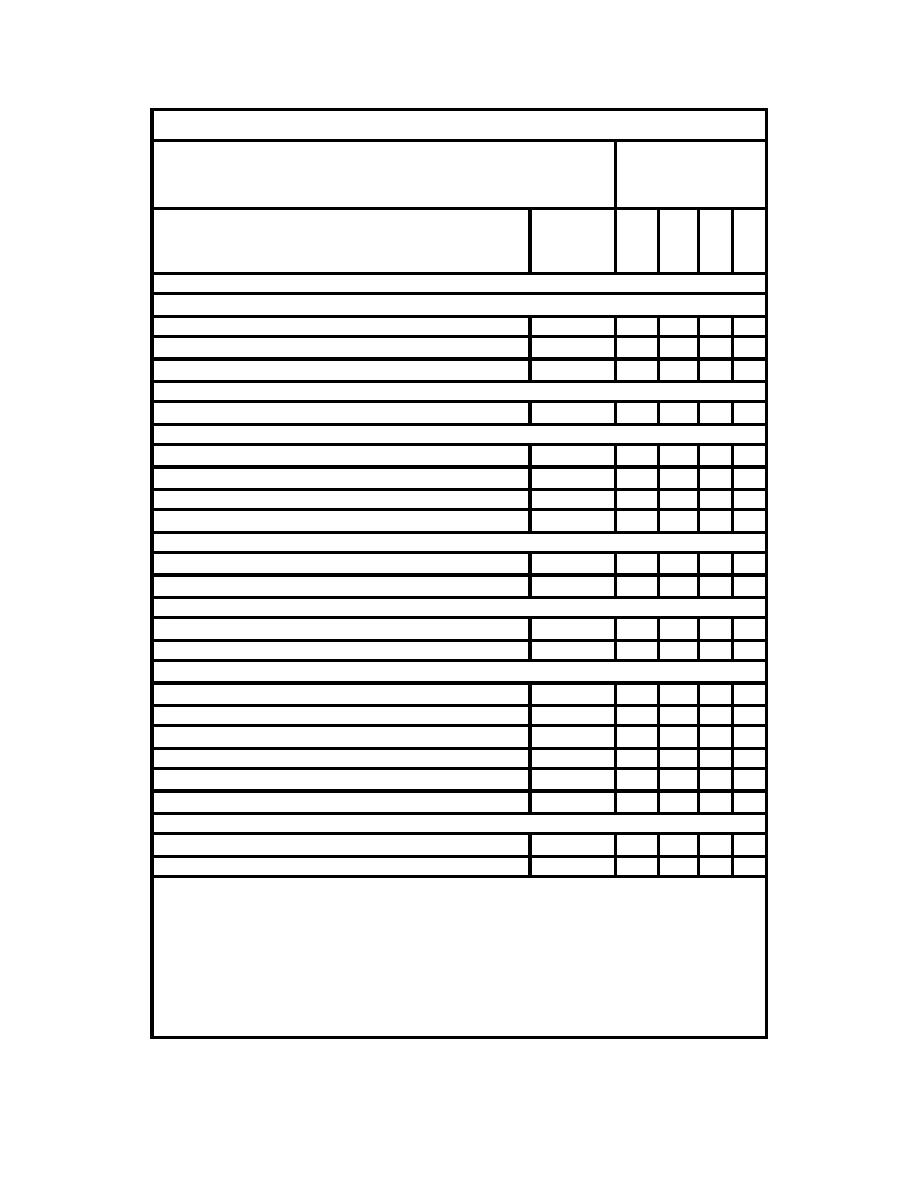
Table 1.1.8. Urban Runoff Curve Numbers
Curve Numbers for
Cover Description
Hydrologic Soil
Group
Average
Cover Type and Hydrologic Condition
Percent
A
B
C
D
Impervious
Fully Developed Urban (vegetation established
Open space (lawns, parks, golf courses, cemeteries, etc.)3
Poor condition (grass cover <50%)
68
79
86
89
Fair condition (grass cover 50% to 70%)
49
69
79
84
Good condition (grass cover >75%)
39
61
74
80
Impervious areas:
Paved parking lots, roofs, driveways, etc.
98
98
98
98
Streets and roads:
Paved; curbs and storm sewers (excluding right-of-way)
98
98
98
98
Paved: open ditches (including right-of-way)
83
89
92
93
Gravel (including right-of-way)
76
85
89
91
Dirt (including right-of-way)
72
82
87
89
Western desert urban areas
Natural desert landscaping (pervious areas only)4
63
96
96
96
Artificial desert landscaping (impervious weed, barrier, desert shrub
96
96
96
96
Urban districts:
Commercial and business
85
89
92
96
95
Industrial
72
81
88
91
93
Residential districts by average lot size:
1/8 acre of less (townhouses)
65
77
85
90
92
acre
38
61
75
83
87
1/3 acre
30
57
72
81
86
acre
25
54
70
80
85
1 acre
20
51
68
79
84
2 acres
12
46
65
77
82
Developing Urban Areas
Newly graded areas (previous areas only, no vegetation)5
77
86
91
94
Idle lands (CN's are determined using cover types)
Average runoff conditions and Ia = 0.2S. 2The average percent impervious area shown was used to develop the composite CN's.
1
Other assumptions are as follows: impervious areas are directly connected to the drainage system, impervious areas have a CN of 98,
and pervious areas are considered equivalent to open space in good hydrologic condition. CN's for other combinations of conditions
may be computed for other combinations of conditions may be computed using Figure 2-3 or 2-4. 3CN's shown are equivalent to
those of pasture. Composite CN's may be computed for other combinations of open space cover type. 4Composite CN's for natural
desert landscaping should be computed using Figures 2-3 or 2-4 based on the impervious area percentage (CN = 98) and the pervious
area CN. The pervious area CN's are assumed equivalent to desert shrub in poor hydrologic condition. 5Composite CN's to use for
the design of temporary measures during grading and construction should be computed using Figure 2-3 or 2-4, based on the degree
of development (impervious area percentage) and the CN's for the newly graded pervious areas.
(After SCS, 1986)
1.1-31

 Previous Page
