

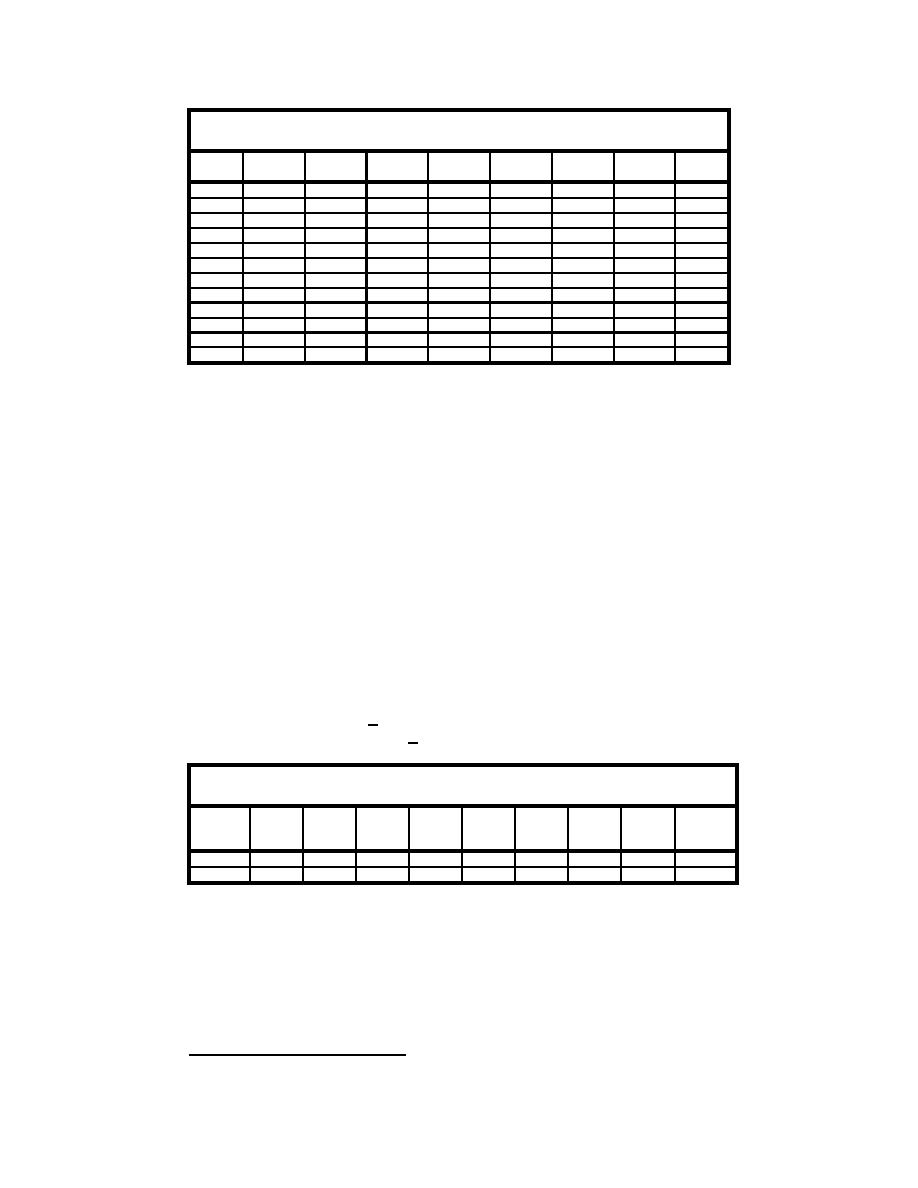
Table A2
Primary Data Set from Irregular Wave Test 8E
X-Loc.
Y19
Y23
Y27
Y31
Vavg
d
ηavg
Hmo-avg
m
m/s
m/s
m/s
m/s
m/s
m
m
m
4.12
0.188
0.227
0.207
0.154
0.194
0.037
0.016
0.053
5.72
0.303
0.326
0.316
0.306
0.313
0.091
0.013
0.082
7.12
0.326
0.341
0.333
0.346
0.337
0.137
0.006
0.107
8.62
0.297
0.313
0.298
0.309
0.304
0.187
0.001
0.138
10.12
0.270
0.277
0.267
0.267
0.270
0.237
-0.001
0.167
11.52
0.228
0.233
0.226
0.221
0.227
0.284
-0.004
0.185
13.12
--
--
--
--
--
0.337
-0.008
0.206
13.88
0.122
0.128
0.121
0.125
0.124
0.363
--
--
14.62
--
--
--
--
--
0.387
-0.009
0.214
16.12
0.038
0.012
0.010
0.031
0.023
0.437
-0.010
0.224
16.85
--
--
--
--
--
0.462
-0.008
0.227
18.00
--
--
--
--
--
0.500
-0.007
0.232
Table A-3 provides a number of other measured and calculated wave and
water level quantities in the surf zone, where h is the longshore-averaged mean
water depth (equal to d + η), η is the mean water surface elevation, ηm is the
maximum value of wave setup, estimated by linear extrapolation, γ is the surf
zone averaged value of H/h, and the subscript, "br", refers to values at the
breaker line. The breaking wave angle, θbr, was estimated using Snell's law.
For the regular wave case, the breaking point is assumed to be the point
where the measured wave height reaches its maximum value. For the irregular
wave case, the breaking point was assumed to be the point where the measured
significant wave height began to decrease at the highest rate (Figure 68). This
occurred at the location x = 13.1 m, where the longshore-averaged significant
wave height was 0.21 m.
Estimates of the position of the mean waterline are x = 2.1 m for the regular
wave case and x = 2.4 m for the irregular wave case. It should be noted that the
cross-shore position of the mean waterline could only be estimated with an
accuracy of approximately +0.1 m. Therefore, the estimates of maximum wave
setup are only accurate to within + 0.003 m.
Table A3
Summary of Wave and Water Level Conditions in the Surf Zone
X-Loc.
X-Loc
Hbr
hbr
Hbr/hbr
γ
Θbr
Xbr
ηm
at ηm
at SWL
Test
m
m
-
-
deg
m
m
m
m
Test 6N
0.254
0.274
0.93
0.74
6.7
11.5
0.033
2.1
3.00
Test 8E
0.206
0.329
0.63
0.75
7.3
13.1
0.021
2.4
3.00
Figure A-1 shows the cross-shore variation in the vertical structure of the
mean longshore current for the regular wave case (Test 6N). In general, the
mean longshore current is rather uniform with depth. In the innersurf zone
(ADV 1 through ADV 5), there is a slight increase in current speed with distance
from the bed, and outside the surf zone (ADV 7 and 8) a slight decrease in
current speed with distance from the bed. Visser (1991)1 measured similar trends
in the vertical velocity structure using regular waves. Putrevu and Svendsen
1
References are listed in section following main text.
A2
Appendix A
Hydrodynamic Data from Fixed-bed Experiments

 Previous Page
