Table 4
Summary of Incident Wave Conditions
Θ1
H1/λ1
H0/λ0
Θ0
H0
Test
Wave
T
H1
d1
m
m
deg
m
deg
Type
sec
Test 6A-N
Regular
2.5
0.182
0.031
0.667
10.0
0.189
0.019
16.6
Test 8A-E
Irregular
2.5
0.225
0.038
0.667
10.0
0.233
0.024
16.6
Measurement Methodology
The instrumentation bridge was used to position the wave and current sensors
at various positions along the beach. Transect locations were selected every
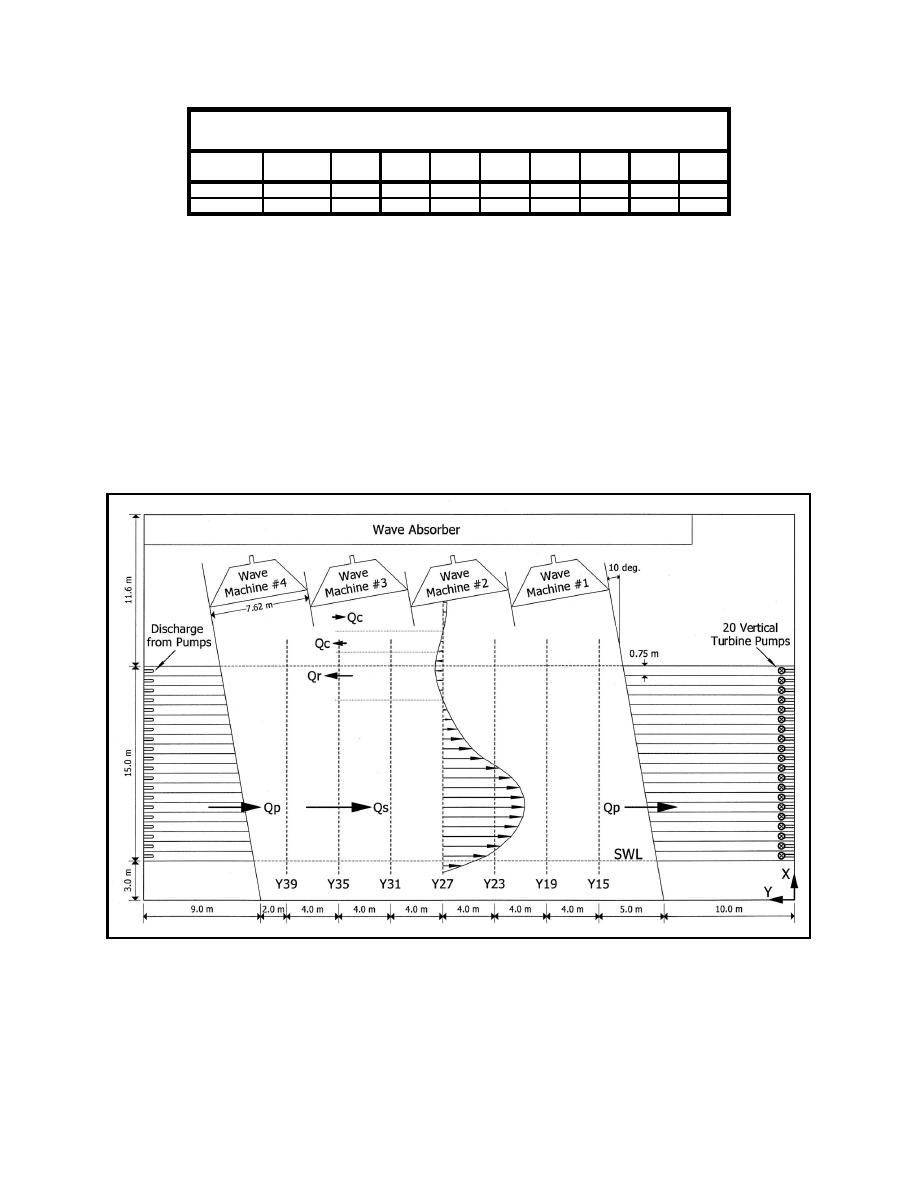
4.0 m, from y=15.0 to y=39.0 m, as shown in Figure 56. Transects are identified
as Y15, Y19, Y23, Y27, Y31, Y35, and Y39, according to their longshore
coordinate. During each experiment, measurements were taken along at least
three primary transects to represent general hydrodynamic conditions along the
beach: Y19 (center of the downstream half of the beach), Y27 (center of the
entire beach), and Y35 (center of the upstream half of the beach). During Test
6N and Test 8E, and several others, measurements were made at all seven
transects.
Figure 56. Plan view of the LSTF and a conceptual diagram of the longshore flow conditions
Wave setup and setdown were obtained by using the wave gauges to measure
the still-water level elevation prior to each experiment and then subtracting that
elevation from the mean water surface elevation measured during the experiment.
103
Chapter 9
Establishing Uniform Longshore Currents


 Previous Page
