

experiments conducted with relatively energetic wave conditions. For all other
cases, the quantity of sand bypassing is negligible.
Analysis of sediment trap data
The cross-shore distribution of the longshore sediment transport rate
measured with the sediment trapping system is calculated by subtracting the
"PreTest Weight" data from the "All Rubber Cleaned" data (Figure 52), and
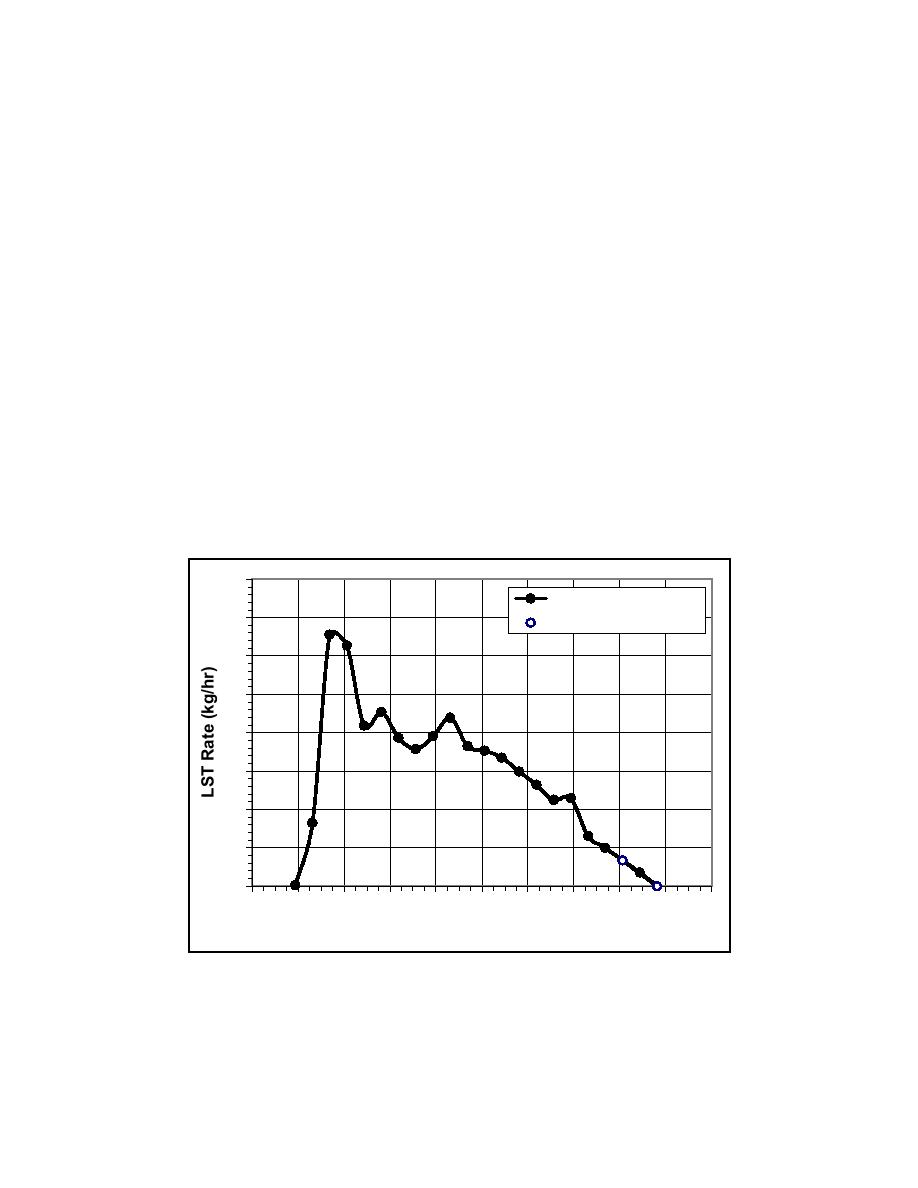
dividing by the duration of the test segment. The duration of Test1H_Case2 was
3.33 hr, and results from this calculation are shown in Figure 53. The cross-
shore location of the center line of each sediment trap is plotted along the x-axis,
as tabulated in Table 2. Recall that there are no sediment traps located in Flow
Channels No. 18 and 20 (i.e., at cross-shore locations 16.125 and 17.625 m). The
sand that accumulated in these two flow channels can be visually inspected after
the facility is drained. For this test segment, the amount of sand in Flow Channel
No. 20 was negligible. This will be the case for most of the experiments
conducted in the facility, except for those conducted with very energetic wave
conditions. However, there was a small amount of sand in Flow Channel No. 18.
This quantity was estimated using linear interpolation between the LST rates
measured in Sediment Traps No. 17 and 19. Integrating across-shore gives a
total measured LST rate of 314.9 kg/hour during this test segment, which
includes the estimated rate of 3.4 kg/hour in Flow Channel No. 18.
40
Measured LST Rate
35
Estimated LST Rate
30
25
20
15
10
5
0
0
2
4
6
8
10
12
14
16
18
20
Cross-shore Location (m)
Figure 53. Cross-shore distribution of longshore sediment transport measured
during the 3.33-hr duration of test segment Test1H_Case2
One of the objectives of the experiments was to attempt to quantify the
change in LST rate during a group of large waves in an irregular wave spectrum.
97
Chapter 8
Sensor Calibration, Measurement, and Data Analysis

 Previous Page
