

D.G. Hamilton, B.A. Ebersole r Coastal Engineering 42 (2001) 199218
212
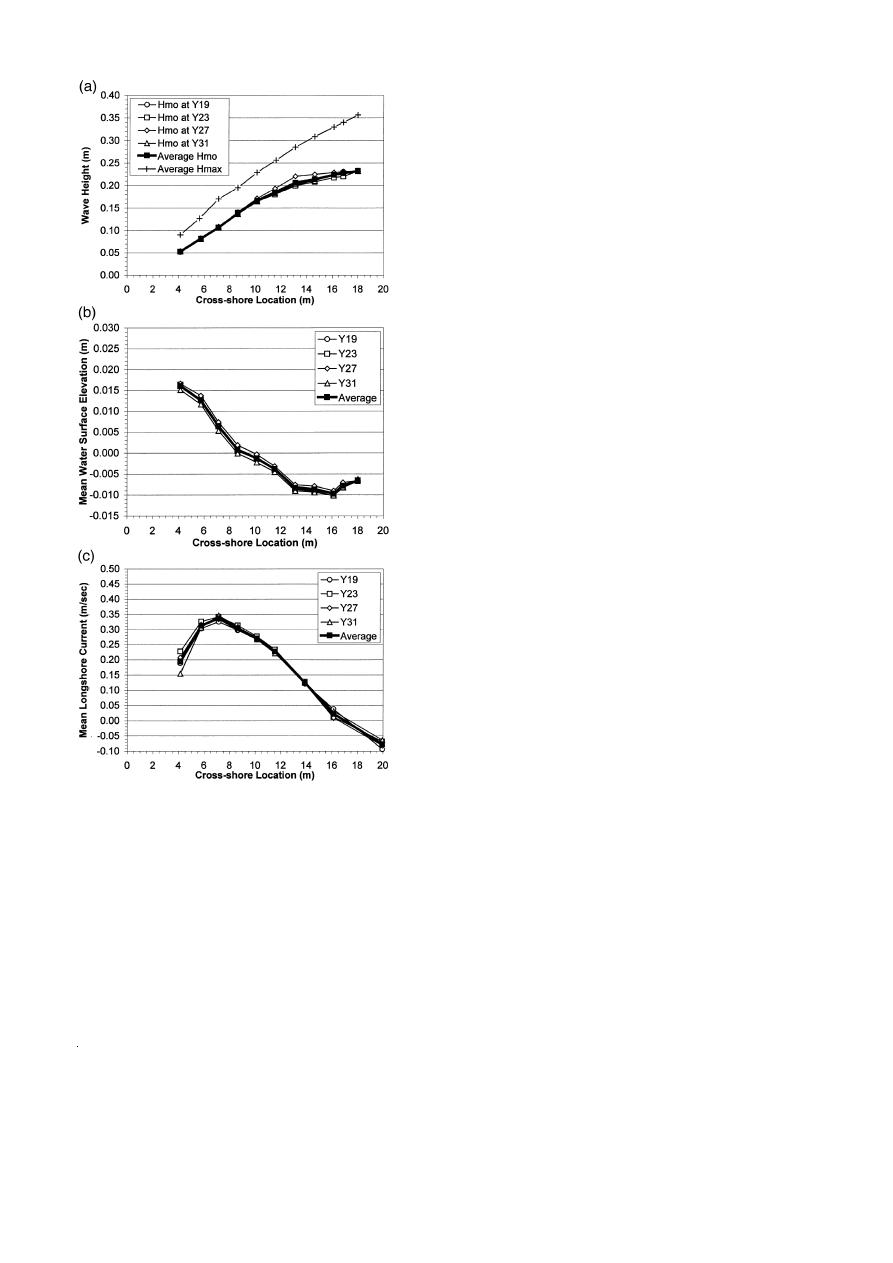
cantly at that location. The longshore averaged
breaker height index, across the width of the surf
zone ZWave Gauge 1 through 7. is calculated to be
0.75, as tabulated in Table A-3 of Appendix A. The
longshore averaged value of the measured maximum
wave height is also shown to illustrate that Hmax )
0.35 m at x s 18 m. As was the case for the regular
wave test, Fig. 14b shows that the alongshore varia-
tion in mean water surface elevation is approxi-
mately "0.0015 m. The wave setup at x s 4.1 m is
only about 60% of the value measured in the regular
wave case, even though the incident wave energy
was held constant by setting Hrms in the irregular
wave case equal to Hreg in the regular wave case.
Fig. 14c shows that the mean longshore current is
very uniform in the longshore direction. The peak
current is 0.34 mrs, relative to a peak current of
0.42 mrs in the regular wave case. The cross-shore
distribution is broader than in the regular wave case,
with the offshore tail decreasing much more uni-
formly. Dye was used to investigate the longshore
current in very shallow water. No local increase in
longshore current was detected shoreward of ADV 1
for either the regular or irregular wave case. It is
interesting to note that the total longshore flow rate
actively pumped through the lateral boundaries, Qp
is 465 and 478 lrs for the regular and irregular wave
cases, respectively. These values are very similar,
since the incident wave energy was held constant for
the two cases, as mentioned previously.
The measured cross-shore distribution of the mean
longshore current at transects Y19 through Y31, and
the longshore-averaged values of the mean longshore
current for these four transects, are provided in
Appendix A. The longshore averaged values of wave
height and mean water surface elevation, from Y19
through Y31, are also provided.
8. Longshore current steadiness and measurement
Fig. 14. Za. Test 8E: distribution of irregular wave height. Zb. Test
repeatability
8E: distribution of mean water surface elevation. Zc. Test 8E:
distribution of mean longshore current.
Individual fixed-bed hydrodynamic experiments
lasted from 2 to 3 h, depending on the number of
cant wave height at incipient breaking occurred im-
transects measured. The plan for moveable-bed long-
mediately shoreward of Wave Gauge 7, based on
shore sediment transport experiments is to also oper-
visual observations and the fact that the gradient in
ate the facility continuously for a several-hour dura-
the significant wave height curve increases signifi-
tion, perhaps longer. Therefore, the issues of current

 Previous Page
