

D.G. Hamilton, B.A. Ebersole r Coastal Engineering 42 (2001) 199218
209
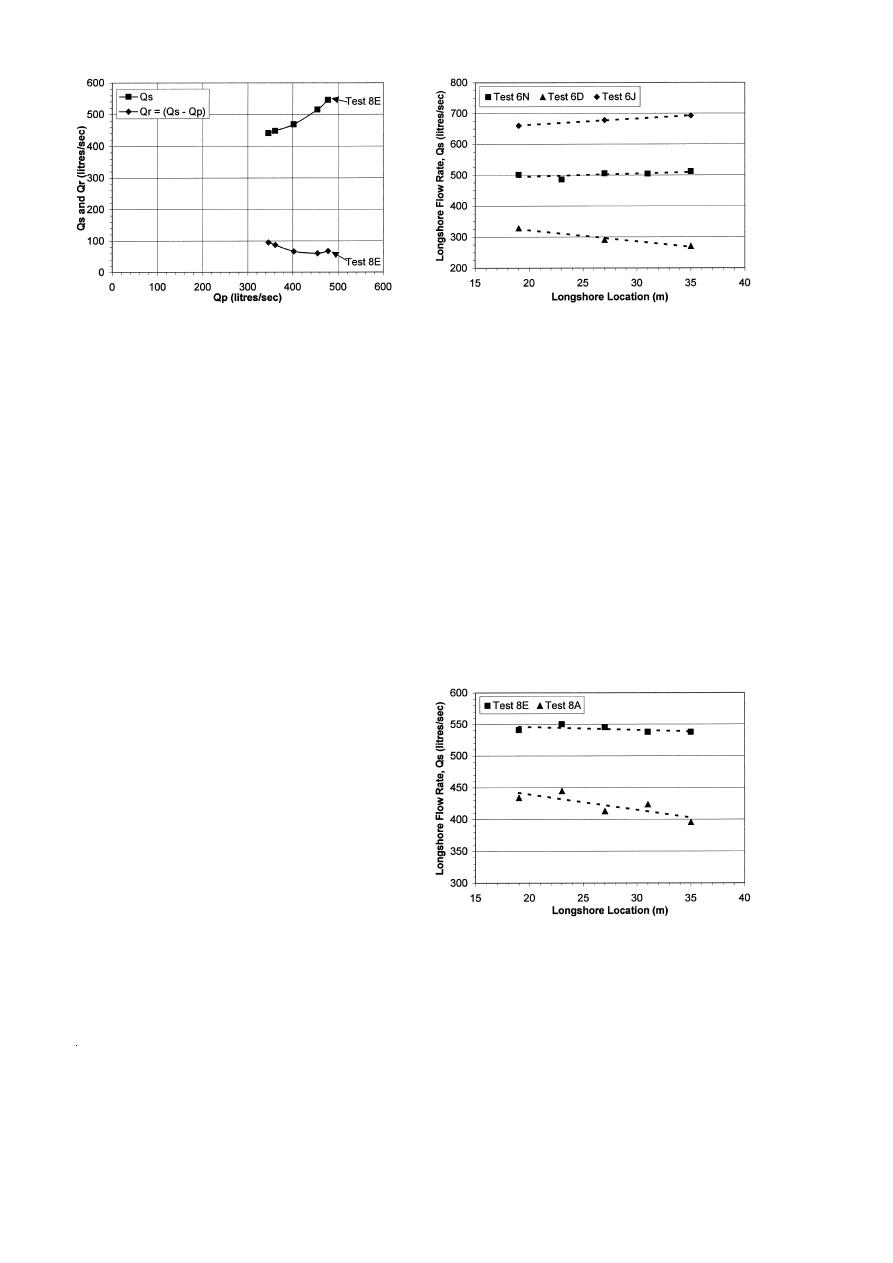
Fig. 9. Regular wave test series: longshore variation in Qs.
Fig. 8. Qs and Qr at Y27 for five irregular wave experiments.
shore direction. These results give credence to the
relatively good agreement. For Test 8E the ratio of
conclusion made previously that Test 6N represents
ZQs y Qp .rQs was approximately 12%. More inter-
the proper longshore current distribution for the reg-
nal recirculation was generated in the irregular wave
ular wave case. However, in the case of under- or
case because 23% of the waves broke slightly
over-pumping, the longshore gradient in Qs is rela-
offshore of x s 18 m, the offshore limit of the
tively small. Therefore, significant care needs to be
external recirculation system.
taken during the iterative process of selecting and
Results for both the regular and irregular wave
converging on the proper longshore current distribu-
test series suggest that the recirculation criteria pro-
tion.
posed by Visser Z1991. is valid for the LSTF. How-
Results from two of the five irregular wave exper-
ever, for the LSTF, the gradient in the Qs y Qp
iments are shown in Fig. 10. In Test 8A, Qp was
curve tends to increase more gradually as Qp is
approximately 28% less than the value of Qp in Test
increased, compared with the results presented by
8E, and Qs increases in the downstream direction.
Visser Z1991.. Figs. 7 and 8 both suggest that Qp
Results for Test 8E Zjudged to be the proper value of
could vary by as much as "20%, relative to Qpu ,
Qp . show that Qs increases slightly in the down-
without a significant increase in Qr .
stream direction, which suggests that Qp may have
6.3. Verification using gradient in Qs concept
The second method proposed by Visser Z1991. is
based on the following hypotheses: Za. if Qp - Qpu ,
then Qs increases in the downstream direction, Zb. if
Qp s Qpu , then Qs is essentially uniform in the
longshore direction, and Zc. if Qp ) Qpu , then Qs
decreases in the downstream direction.
Fig. 9 shows results from three of the 15 regular
wave experiments. In Test 6D, Qp was approxi-
mately 40% less than the value of Qp in Test 6N
Zthe proper value., and Qs increases in the down-
stream direction. Conversely, in Test 6J, Qp was
approximately 47% larger than Qp in Test 6N and,
as shown, Qs decreases in the downstream direction.
In Test 6N, Qs is essentially uniform in the along-
Fig. 10. Irregular wave test series: longshore variation in Qs.

 Previous Page
