

D.G. Hamilton, B.A. Ebersole r Coastal Engineering 42 (2001) 199218
210
been slightly smaller than Qpu . However, this contra-
dicts evidence shown previously in Fig. 8 that sug-
gested that Qp was slightly larger than Qpu. This
slight discrepancy between the two methods may be
caused by the fact that, in the LSTF, Qp can vary by
as much as "20% of Qpu without a significant
increase in Qr , as mentioned previously. Therefore,
it was concluded that Qp in Test 8E was essentially
the proper longshore current distribution for the ir-
regular wave test series. A case involving significant
over-pumping was not conducted for the irregular
wave experiments.
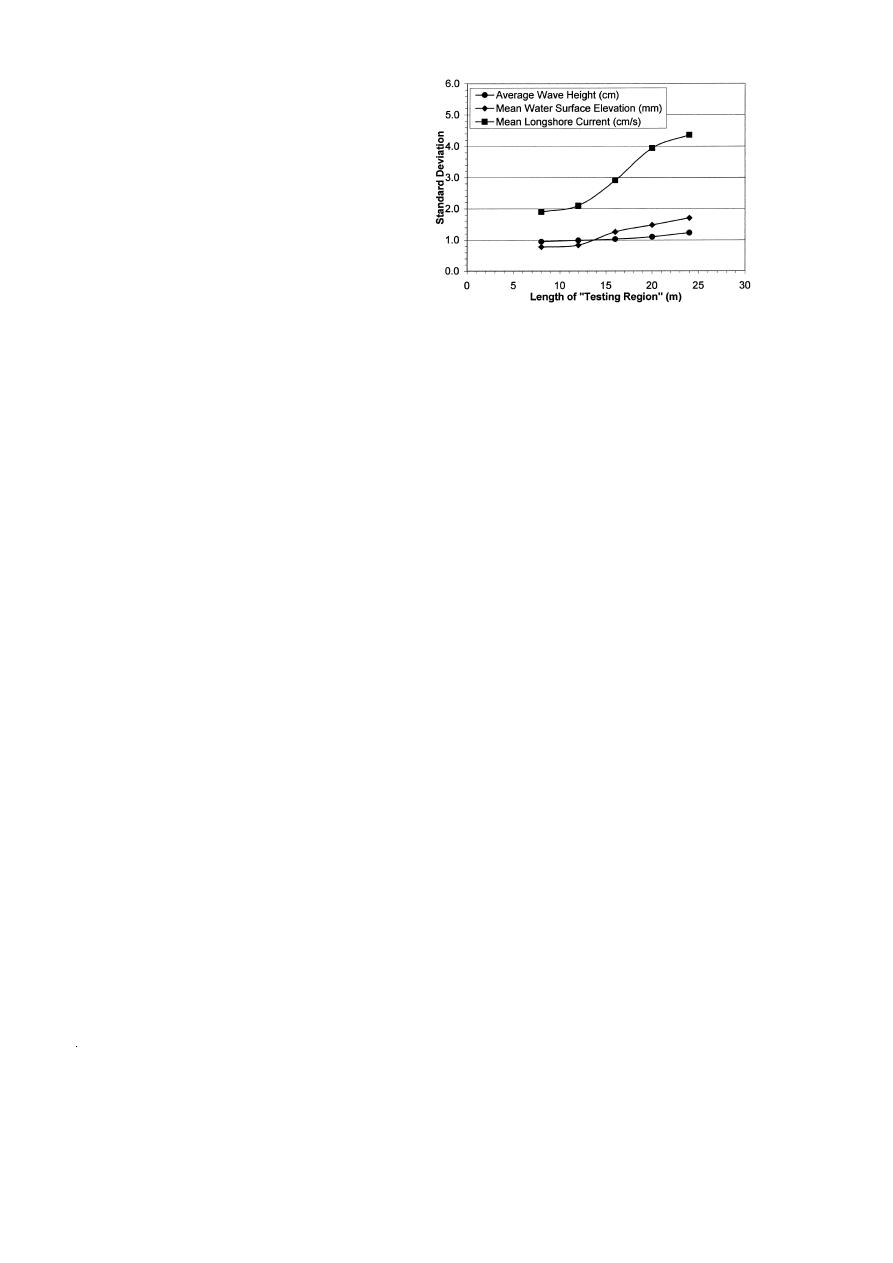
Fig. 11. Test 6N: longshore uniformity of hydrodynamics.
7. Longshore uniformity
This section quantifies the length of surf zone
longshore current, decrease significantly with de-
with the highest degree of longshore uniformity of
creasing length of testing region, and approach a
the hydrodynamic processes. In general, it can be
minimum asymptote at approximately 12 m. If a
assumed that longshore uniformity should increase
shorter length of surf zone is considered, there is no
with increasing distance from the lateral boundaries.
significant increase in uniformity. Therefore, it is
However, from the perspective of measuring long-
concluded that the hydrodynamic measurements have
shore sediment transport in the LSTF, it is important
reached a minimum longshore variability once the
to quantify the spatial limits of this region; especially
length of surf zone being considered is reduced to 12
at the downstream end where sand traps will be
m, starting at Y19 and extending upstream to Y31.
located.
The high degree of longshore uniformity in this
Longshore uniformity was quantified by an aver-
portion of the surf zone is illustrated in Fig. 12ac,
age value of the standard deviation at each cross-
which shows the cross-shore distributions of mea-
shore position, and at each transect within the length
sured wave height, mean water surface elevation,
of surf zone being evaluated. For both Test 6N and
and mean longshore current, respectively, for tran-
Test 8E, the standard deviation was calculated inde-
sects Y19 through Y31. Fig. 12a shows that the
pendently for the wave height, mean water surface
greatest longshore variation in the measured wave
elevation, and mean longshore current data sets. A
height occurred at and immediately offshore of the
new value of the average standard deviation was
incipient breaker line. Wave breaking occurred im-
calculated each time the representative beach length
mediately shoreward of Wave Gauge 6. Deviations
was decreased, by excluding data from one or more
from the longshore averaged wave height were as
large as "8%. This is a laboratory effect caused by
transects from the calculation. Transects at the up-
stream end of the facility were eliminated first, then
generating regular waves in a wave basin with reflec-
transects at the downstream end were eliminated.
tive boundaries. However, the longshore variation in
The length of the surf zone with the highest degree
wave height measured in front of each of the four
of longshore uniformity is defined as the length at
generators Z x s 18 m., had a standard deviation of
which a minimum standard deviation is obtained.
only 2.8%. In the inner surf zone, the longshore
Fig. 11 shows results for the regular wave experi-
uniformity in wave height is very good due to the
ment. Longshore variations in the average wave
dominant effect of depth, which limits wave height.
height measurements tend to decrease only slightly
The longshore averaged breaker height index, across
as the length of beach being considered is decreased.
the width of the surf zone ZWave Gauge 1 through
In contrast, longshore variations in the mean water
6., is calculated to be 0.74, and is tabulated in Table
surface elevation, and more importantly in the mean
A-3 of Appendix A, with several other parameters.


 Previous Page
