

for the Level 2 Gulf hindcast and interpolated to the
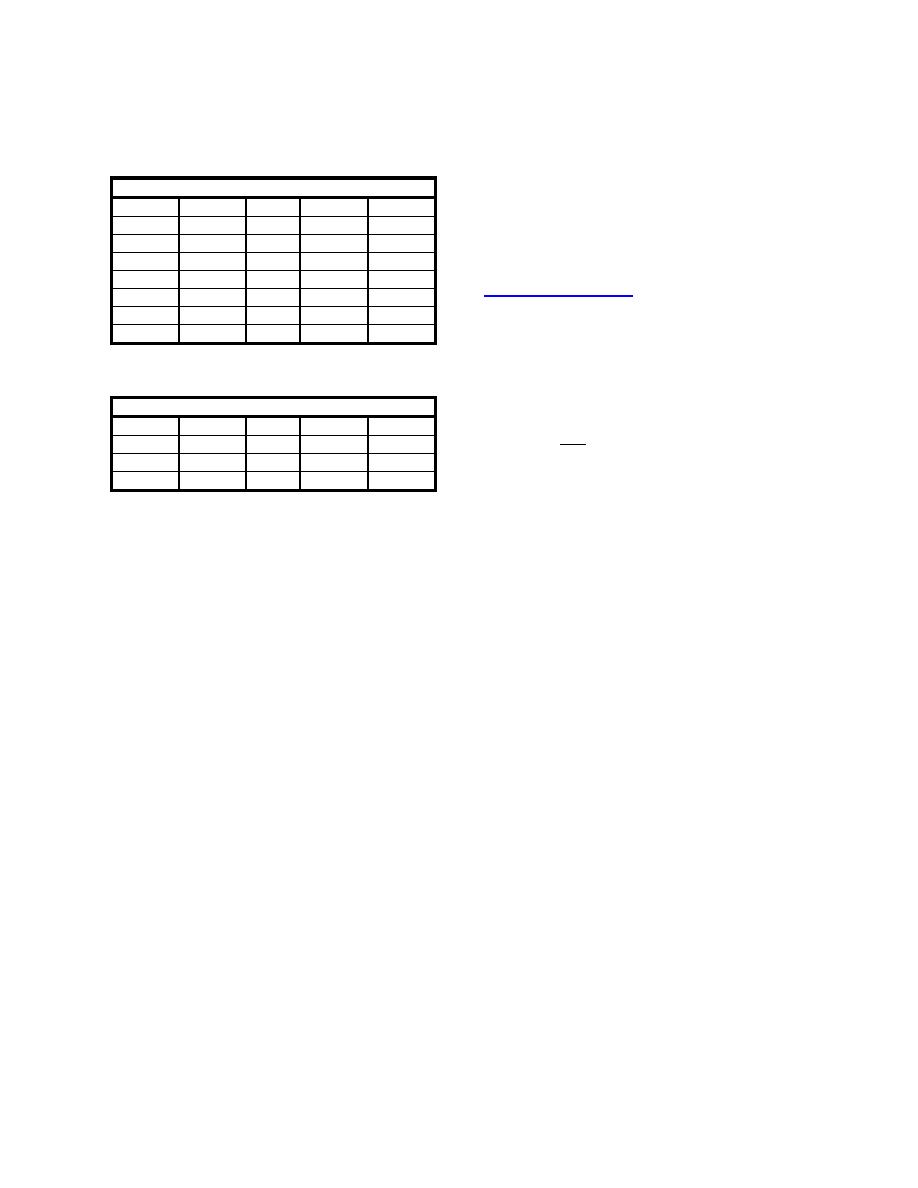
sites in 1995; Table 2 lists the available Level 2 1995
1/12-deg grid for the Level 3 hindcast.
measurement sites. Both tables give location
information, depth of site, and months available.
The 1 deg Atlantic wind fields for Level 1 were taken
from the AES40 Atlantic wind product (Swail, et al.,
Table 1. Level 3 Measurement Sites
2000), which was developed by Oceanweather for the
NDBC
Lon.
Lat.
Dep.(m)
Months
Meteorological Service of Canada (formerly called
42019
-95.00
27.92 100
Jul-Dec
Atmospheric Environment Service). This wind
42020
-96.50
27.00 120
Jan-Dec
product was derived from the 6-hr NCEP/NCAR
42040
-88.25
29.17 170
Dec
reanalysis wind fields. Oceanweather's website
42035
-94.42
29.25 15
Jan-Dec
(www.oceanweather.com) is available for more details
42016
-88.17
30.08 19
May
and references on wind analysis.
42039
-86.00
28.75 300
Dec
42036
-84.50
28.50 51
Jan-Dec
4. NUMERICAL WAVE MODELS
Wave models used in this study include WISWAVE,
WAM, and WAVEWATCH III (version 2.22). These
Table 2. Level 2 Measurement Sites
wave models solve the action balance equation:
NDBC
Lon.
Lat.
Dep.(m)
Months
∂N
n
+ C g ⋅ ∇N = ∑ S i
(1)
42001
-89.75
26.00 3165
Jan-Dec
∂t
42002
-93.50
26.00 3123
Jan-Dec
i=1
where N is action density, t is time, Cg group speed,
42003
-86.00
26.00 3206
Jan-Dec
and Si are source functions consisting of wind input,
dissipation, non-linear wave-wave interactions, and
3. WIND INPUT
bottom effects. Second-generation wave models such
as WISWAVE use a parameterization of the non-
The same input wind fields were used for each of the
linear wave-wave interaction source terms and third-
hindcast applications. The 1990-1999 Gulf wind
generation models like WAM and WAVEWATCH
fields were generated by Oceanweather, Inc., in
use an approximate calculation of this source term.
connection with the WIS mission to develop hindcasts
All wave models strive to represent the physics of
for all the US coastlines. Oceanweather, Inc., has
wave growth, development, dissipation, and
vast experience in both the theoretical and practical
interaction. All the models simulate directional
aspects of wind modeling products. Cox and Cardone
spectra to produce the energy-based significant wave
(2002) gives an overview of Oceanweather's analysis
height and details about the wave spectrum such as
capabilities.
peak wave period and vector mean wave direction for
designated output stations. Brief descriptions of the
The Gulf wind fields (0.25 deg spacing) were
wave models are given with references. All these
developed using National Centers for Environmental
models are well-known to the wave modeling
Prediction (NCEP) wind fields (at 6 hr intervals)
community, and they all have excellent reputations.
available from NOAA. Swail, Ceccacci, and Cox,
2000, describes the NCEP/NCAR reanalysis product
4.1 WISWAVE
which was used for the Gulf wind fields. The NCEP
winds have approximately 1.9 deg spacing.
The WIS hindcasts use the numerical wave hindcast
Oceanweather's process included interpolation from 6
model, WISWAVE, developed by Don Resio for the
hours to 1 hour, applying NCEP wind corrections by
Army Corps of Engineers. WISWAVE has been used
grid point and assimilation of measured wind
extensively in wave hindcasting at U.S. Army Corps
information to create a 1-hr product on a 0.25 deg
of Engineers (USACE) offices and throughout the
grid. Oceanweather is noted for specification of
engineering community. WISWAVE uses the time-
tropical storm wind fields using their Planetary
dependent wave action balance equation to create a
Boundary Layer wind model described in Thompson
directional spectral matrix with twenty frequencies
and Cardone (1996). Cox and Cardone (2000)
and 16 direction bands at each grid point on a land-sea
describes their tropical storm analysis. Tropical storm
mesh derived from a latitude-longitude grid including
winds were assimilated into the final wind field. The
finite depths for each grid point. Wave growth is
final product represents hourly Gulf wind fields
based on the Phillips and Miles mechanism; weak
utilizing all available information and expert
nonlinear wave-wave interaction, equilibrium Jonswap
meteorological analysis. These wind fields were used
and Kitaigorodskii spectral functions, linear refraction,

 Previous Page
