

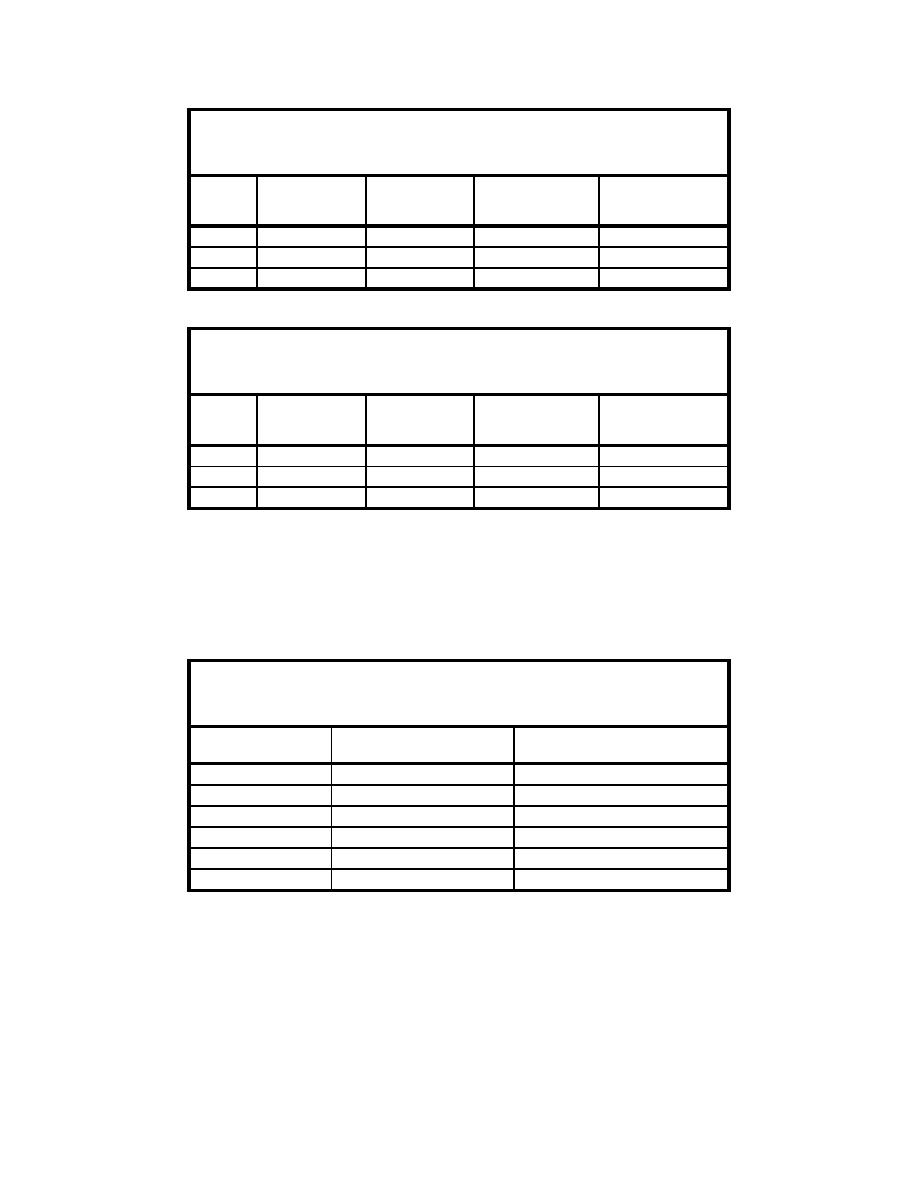
Table B47
Velocity Measurements with 3-m, 13-sec Waves at mhw from
West-Northwest with Alt 2A and 5-year Projected Shoreline
Ave. Vel.
Ave. Vel.
Ave. Vel.
ADV
Offshore
South
of Ave. Vel.
No.
(cm/sec)
(cm/sec)
(cm/sec)
(cm/sec)
2
-15.31
15.28
61.24
21.63
3
-2.19
28.01
61.57
28.1
4
-35.83
-4.77
83.59
36.15
Table B48
Velocity Measurements with 5-m, 13-sec Waves at mhw from
West-Northwest with Alt 2A and 5-year Projected Shoreline
Ave. Vel.
Ave. Vel.
Ave. Vel.
ADV
of Ave. Vel.
South
Offshore
(cm/sec)
(cm/sec)
(cm/sec)
(cm/sec)
No.
2
-12.20
29.26
74.66
31.70
3
-13.07
32.73
72.82
35.24
4
-71.41
25.07
123.33
Storms from southwest
Wave heights and wave periods. Tables B49 through B55 list wave heights
and periods collected during experiments with Alt 2A and the shoreline projected
by numerical model GENESIS for 5 years after installation of Alt 2A.
Table B49
Wave Heights and Periods for 2-m, 9-sec Waves from Southwest
at mllw, Alt 2A with 5-year Projected Shoreline
Height
Period
Gauge No.
(m)
(sec)
1
2.08
9.09
2
2.22
9.09
9
1.69
8.65
17
1.54
9.09
25
1.12
9.09
33
1.64
9.34
B146
Appendix B Physical Modeling of North Beach and Jetty

 Previous Page
