

Tables for GENESIS 5-Year Projected Shoreline
Storms from west-northwest
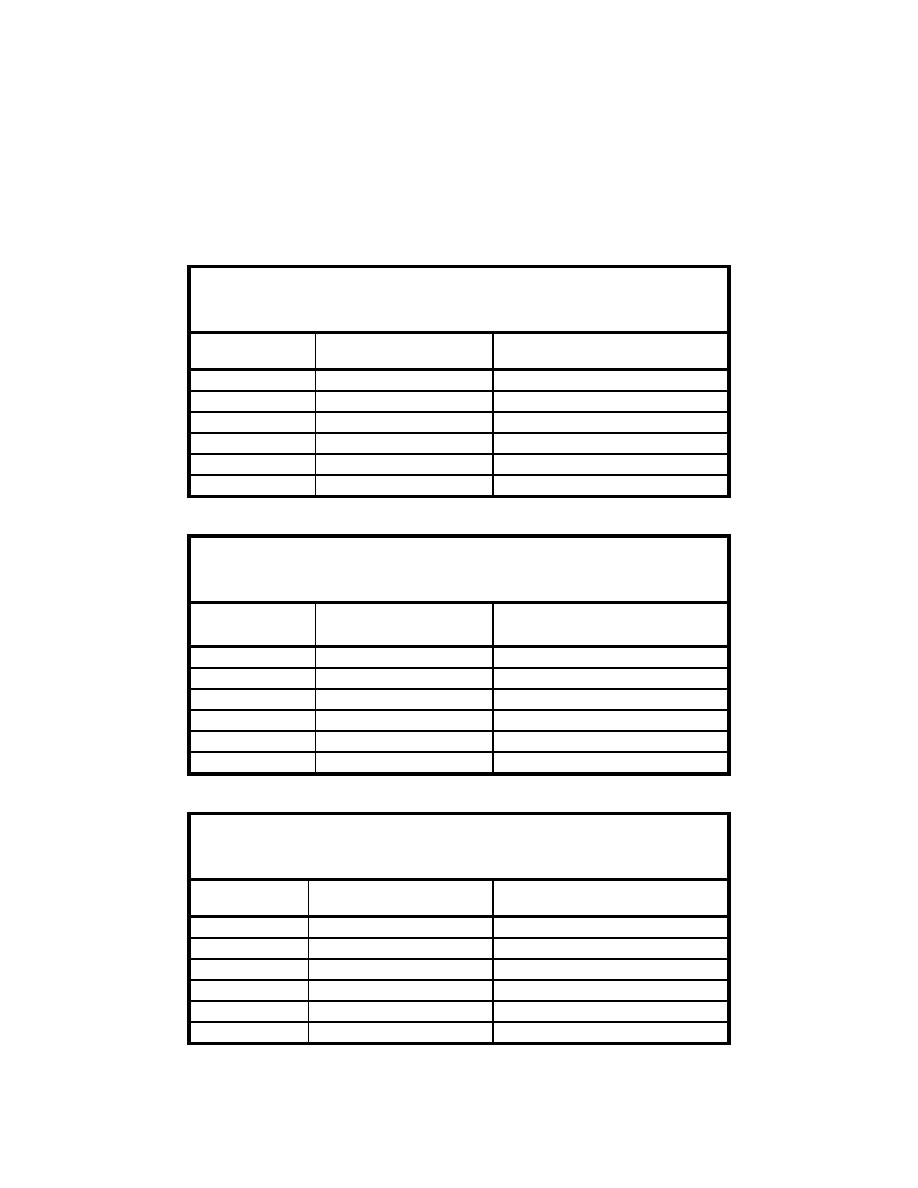
Wave heights and wave periods. Tables B37 through B42 list wave heights
and periods collected during experiments with Alt 2A and the shoreline projected
by numerical model GENESIS for 5 years after installation of Alt 2A.
Table B37
Wave Heights and Periods for 2-m, 9-sec Waves from West-
Northwest at mllw, Alt 2A with 5-year Projected Shoreline
Wave Height
Wave Period
Gauge No.
(m)
(sec)
1
2.08
8.87
2
2.20
9.09
9
1.70
9.09
17
2.17
9.34
25
1.54
9.09
33
1.67
9.34
Table B38
Wave Heights and Periods for 3-m, 12-sec Waves from West-
Northwest at mllw, Alt 2A with 5-year Projected Shoreline
Wave Height
Wave Period
Gauge No.
(m)
(sec)
1
2.82
12.67
2
3.01
13.14
9
2.10
118.21
17
2.65
14.19
25
2.66
14.19
33
2.31
14.19
Table B39
Wave Heights and Periods for 5-m, 13-sec Waves from West-
Northwest at mllw, Alt 2A with 5-year Projected Shoreline
Wave Height
Wave Period
Gauge No.
(m)
(sec)
1
4.63
12.67
2
5.03
13.14
9
2.27
118.21
17
2.76
14.19
25
2.71
35.47
33
2.44
14.78
B143
Appendix B Physical Modeling of North Beach and Jetty

 Previous Page
