

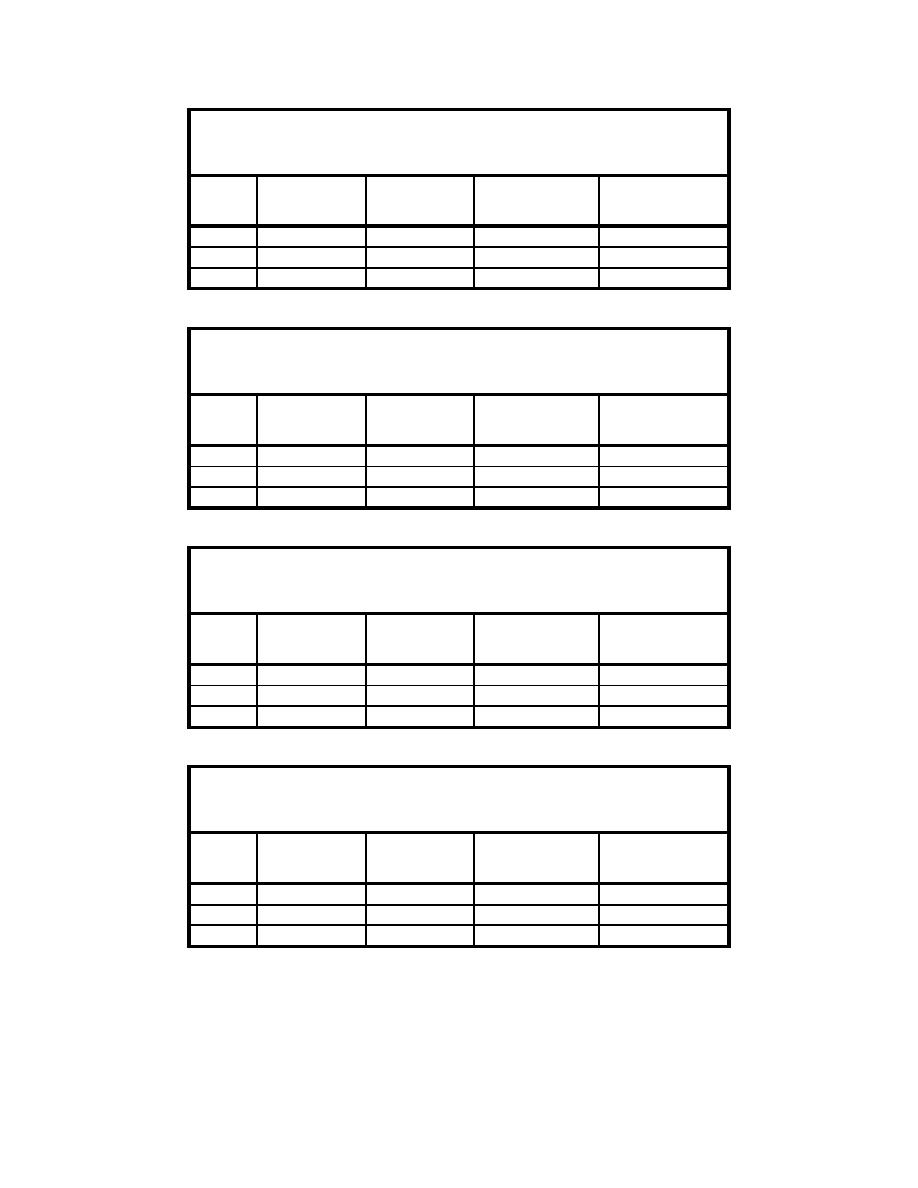
Table B43
Velocity Measurements with 2-m, 9-sec Waves at mllw from West-
Northwest with Alt 2A and 5-year Projected Shoreline
Ave. Vel.
Ave. Vel.
Ave. Vel.
ADV
Offshore
South
of Ave. Vel.
No.
(cm/sec)
(cm/sec)
(cm/sec)
(cm/sec)
2
-14.3
19.24
41.74
23.97
3
4.2
18.92
36.44
19.38
4
-3.64
16.38
55.67
16.78
Table B44
Velocity Measurements with 3-m, 13-sec Waves at mllw from West-
Northwest with Alt 2A and 5-year Projected Shoreline
Ave. Vel.
Ave. Vel.
Ave. Vel.
ADV
Offshore
South
of Ave. Vel.
No.
(cm/sec)
(cm/sec)
(cm/sec)
(cm/sec)
2
-16.82
29.58
66.78
34.03
3
-10.24
67.44
93.85
68.21
4
75.61
93.84
78.01
Table B45
Velocity Measurements with 5-m, 13-sec Waves at mllw from West-
Northwest with Alt 2A and 5-year Projected Shoreline
Ave. Vel.
Ave. Vel.
Ave. Vel.
ADV
Offshore
South
of Ave. Vel.
No.
(cm/sec)
(cm/sec)
(cm/sec)
(cm/sec)
2
-19.27
16.14
59.93
25.14
3
-8.06
18.03
50.03
19.75
4
-10.88
31.86
90.30
33.67
Table B46
Velocity Measurements with 2-m, 9-sec Waves at mhw from West-
Northwest with Alt 2A and 5-year Projected Shoreline
Ave. Vel.
Ave. Vel.
Ave. Vel.
ADV
Offshore
South
of Ave. Vel.
No.
(cm/sec)
(cm/sec)
(cm/sec)
(cm/sec)
2
-16.64
13.29
36.93
21.30
3
7.91
4.65
36.35
9.18
4
-0.73
-8.75
51.71
8.78
B145
Appendix B Physical Modeling of North Beach and Jetty

 Previous Page
