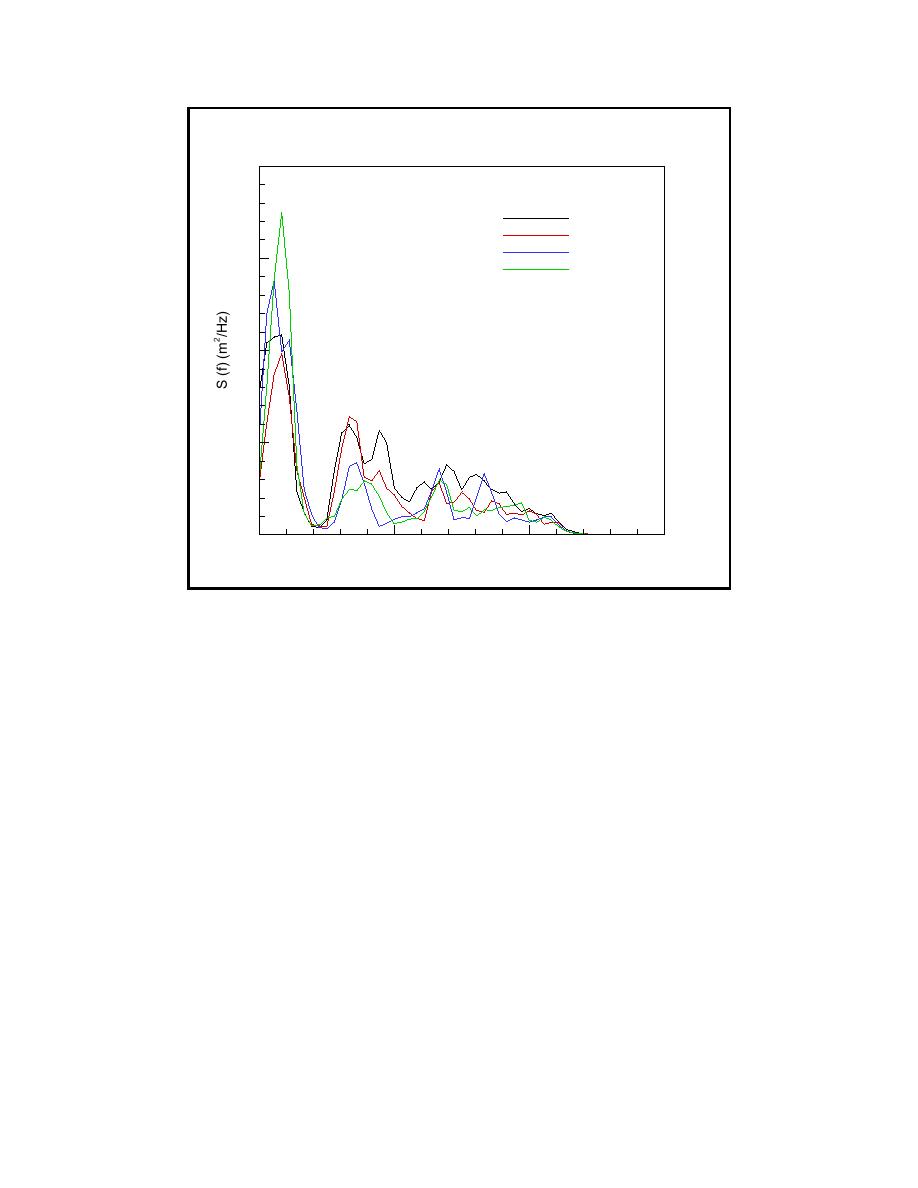
Home
Download PDF
Order CD-ROM
Order in Print
Home
>
Coastal and Hydraulics Laboratory Fact Sheets
>
> Figure 43. Predicted wave spectra at gauges inside harbor basin (Gauges 3-6) for an irregular sea state (Hmo = 3 m, Tp = 12 s)
Figure 42. Predicted wave spectra at the outside Gauges 1 and 2 for an irregular sea state (Hmo = 3 m, Tp = 12 s)
References - BOUSS-2D0075
BOUSS-2D
Page Navigation
61
62
63
64
65
66
67
68
69
70
71
0.8
Gauge
#3
Gauge
#4
Gauge
#5
0.6
Gauge
#6
0.4
0.2
0
0
0.1
0.2
0.3
Frequency
(Hz)
Figure
43.
Predicted
wave
spectra
at
gauges
inside
harbor
basin
(Gauges
3-6)
for
an
irregular
sea
state
(
H
mo
= 3 m,
T
p
= 12 s)
66
Chapter
5
Model
Validation