

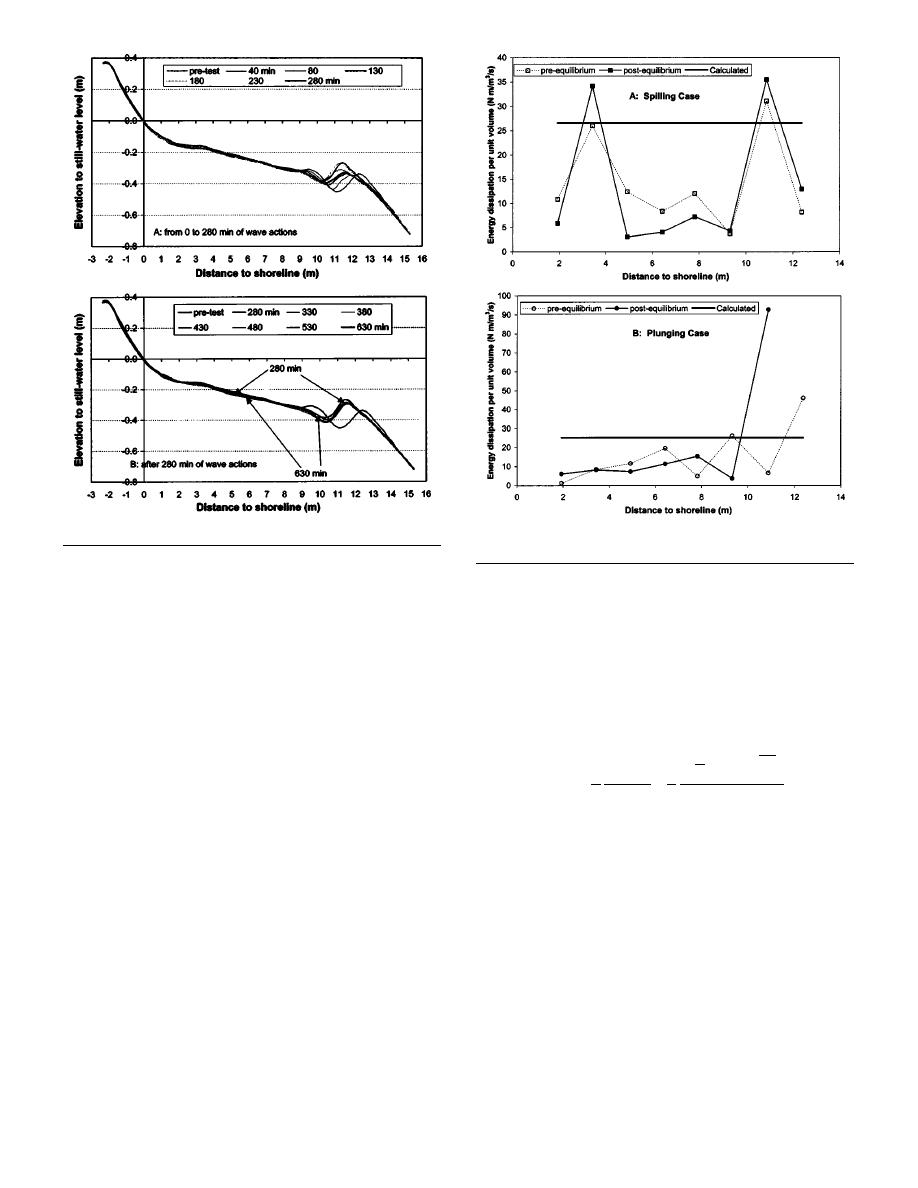
Fig. 3. Beach-profile evolution, plunging case
Fig. 4. Cross-shore distribution of D ( x ) , at the beginning of the
experiment and at equilibrium
A higher wave of H mo 0.45 m was run before the plunging
case, resulting in the development of a substantial offshore bar
just outside the surf zone. In response to the reduced wave height,
the equilibrium profiles for the spilling and plunging cases are
a landward migration of the offshore bar occurred Fig. 3 A .
represented by the time averages between 1,330 and 1,990 min
This bar migration resulted in substantial elevation gain in the
and 280 and 630 min, respectively.
previous trough and elevation loss at the previous bar crest and its
seaward slope. The secondary bar that had developed just land-
Uniform Energy Dissipation per Unit Volume
ward of the original trough between 9 and 10 m was eroded, and
Dean 1977 related the equilibrium profile Eq. 1 to uniform
the sand was apparently transported a short distance seaward and
wave-energy dissipation per unit volume. The wave-energy dissi-
contributed to the building of the new bar. The new bar crest was
pation per unit volume, D ( x ) , is determined as
located at the position of the previous trough, and the previous
x
secondary bar became the landward slope of the new trough.
gh
1 g H rms
2
These changes occurred in a narrow zone between 9 and 14 m
Ex g
C
8
1
1
D x
(2)
near the main plunging breaker line during a 280 min wave ac-
h
h
tion. The volume eroded equaled roughly to the volume gained at
where H rms root-mean-square wave height, and equals 0.71 H mo
the new bar. Little change occurred at the seaward limit of the
assuming a Rayleigh distribution of wave height. The H rms
profiles, near the shoreline, and across most of the midsurf zone.
0.71 H mo values are used here instead of the values obtained
Magnitudes of profile change between 280 and 630 min were
through zero-crossing analyses because this assumption is often
much smaller than those before 280 min, indicating that the beach
has approached equilibrium Fig. 3 B . The landward migration
used in modeling efforts. D ( x ) was calculated from the measure-
ments at two adjacent wave gauges and represented at the mid-
of the bar was replaced by irregular and minor variations. In Fig.
3 B , the profiles at 280 and 630 min were highlighted; profiles at
point. The wave gauges were spaced at 1.5 m apart. The energy-
other times thin lines did not follow the same trend. Persistent
dissipation rate obtained from the two closely spaced gauges
shoreline erosion measured during the spilling case Fig. 2 was
should be reliable. The energy-dissipation patterns were calcu-
not apparent during the plunging case Fig. 3 . The steep offshore
lated at the beginning and end of each wave case. The purpose
was to examine the adjustment of wave-energy dissipation as the
toe may influence wave shoaling and refraction. However, since
profile approached equilibrium.
measured in situ breaking wave conditions are used here, this
For the spilling case, the overall energy-dissipation patterns
influence should already be incorporated.
before 0 45 min and after the equilibrium average between
1,330 and 1,990 min were similar Fig. 4 A . A steep gradient in
State of Equilibrium
D ( x ) occurred at the main breaker line. Another peak occurred at
approximately 3.4 m, the reason for which was not clear. Except
The beach reached equilibrium, or stable shape, after 1,330 and
for these two locations, D ( x ) was fairly uniform after the equi-
280 min of spilling and plunging wave action, respectively. Here,
JOURNAL OF WATERWAY, PORT, COASTAL AND OCEAN ENGINEERING / JANUARY/FEBRUARY 2003 / 43

 Previous Page
