

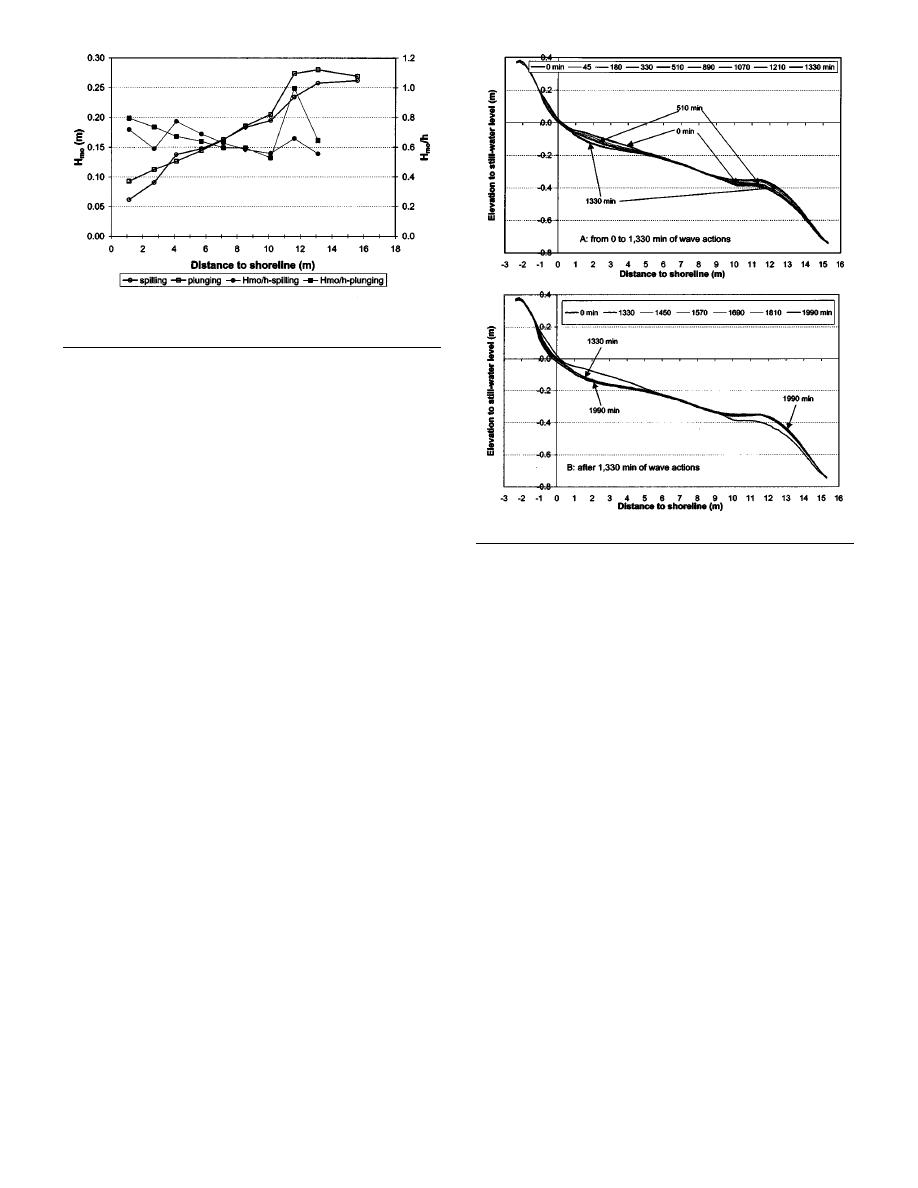
Fig. 1. Cross-shore distribution of significant wave height and the
base and extended 27 m alongshore and 18 m cross shore, of
which 15 m were below still-water level and 3 m were above. The
experimental procedures are discussed in Wang et al. 2002 .
The spilling- and plunging-breaker cases lasted 1,990 and 630
min, respectively. The spilling-breaker experiment was conducted
in eighteen 15200 min segments, and the plunging case in thir-
teen 40100 min segments. The LSTF hosts a suite of sensors
measuring wave, current, and sediment concentration Wang et al.
2002 . All the sensors are mounted on a steel bridge that spans
Fig. 2. Beach-profile evolution, spilling case
across the test beach. This bridge can be programed to move
precisely along shore, allowing measurements to be made along
transects at various longshore positions.
The beach profile was surveyed at the end of each wave-run
followed by a sharp decline to slightly less than 0.6. A trend of
landward increase of the H mo / h ratio, from slightly below 0.6 to
segment using a bottom-tracking profiler that moved along the
instrument bridge. The profiles were spaced at 1 m along shore
nearly 0.8, was measured across most of the surf zone for both the
spilling and plunging cases. Similar values of H mo and H mo / h
and sampled at 0.5 cm cross shore. The vertical accuracy of the
profiler was within 1.5 mm. The longshore gradients in longshore
were measured in the surf-bore dominated midsurf zone for both
transport were negligible across the middle section of the test
cases, while conditions near the main breaker line and the shore-
line were different Fig. 1 .
beach, and the longshore currents, mostly less than 20 cm/s,
should not contribute significantly to sediment suspension Wang
et al. 2002 . Therefore, beach-profile change should be mostly
Results and Discussion
caused by gradients in cross-shore sediment transport. The fol-
lowing discussion is focused on the middle 15 m of the beach,
where influences of lateral boundaries were minimal.
Beach-Profile Evolution
The beach was initially constructed based on the Dean 1977
m
odel Eq. 1 . The average of the middle 15 profiles serves as a
Wave Conditions
representative profile. The spilling-breaker experiment was con-
The TMA spectrum with a spectral width parameter of 3.3 defined
ducted with the constructed beach as the initial condition. Most of
the incident wave Wang et al. 2002 . The main breaker line was
the beach-profile change occurred during the first 1,330 min of
located at 13.1 second point from offshore and 11.6 m third
wave action Fig. 2 A . In Fig. 2 and the following figures, the
point from offshore from the shoreline for the spilling and plung-
shoreline in the horizontal axis was defined as that of the initially
ing cases, respectively Fig. 1 . The main breaker line was deter-
constructed beach, which was 3.0 m from the basin wall. During
mined to be at the location landward of which a significantly
the first 1,330 min, the inner surf zone from 1 to 5 m experienced
accelerated rate of wave-height decay was measured. This crite-
erosion. The outer surf zone from 5 to 9 m remained stable. Sand
rion was based on the comprehension that a substantial wave-
accumulation occurred in the vicinity of the breaker line from 9 to
energy loss, and therefore, wave-height decrease, should follow
14 m, the source of which was apparently the erosion in the inner
surf zone. In Fig. 2 A , profiles at 0, 510, and 1,330 min were
major wave breaking.
highlighted; profiles at other times thin lines followed the same
Similar breaker heights of 0.26 and 0.27 m were measured for
the spilling and plunging cases, respectively. The accuracy of the
trend. After 1,330 min, the rate of profile change was small; pro-
capacitance wave gauges was 2 mm Wang et al. 2002 . The
files at 0; 1,330; and 1,990 min were highlighted Fig. 2 B . In
ratio of significant wave height ( H mo) to still-water depth h , the
order to induce characteristic spilling breakers, waves with a
breaker index, ranged mostly from 0.6 to 0.8 Fig. 1 . A large
steepness of 0.08 were generated. These steep waves are respon-
sible for the persistent erosion at the shoreline Fig. 2 .
value, nearly 1.0, was measured at the plunging breaker line,
42 / JOURNAL OF WATERWAY, PORT, COASTAL AND OCEAN ENGINEERING / JANUARY/FEBRUARY 2003

 Previous Page
