

3.8 Socioeconomics
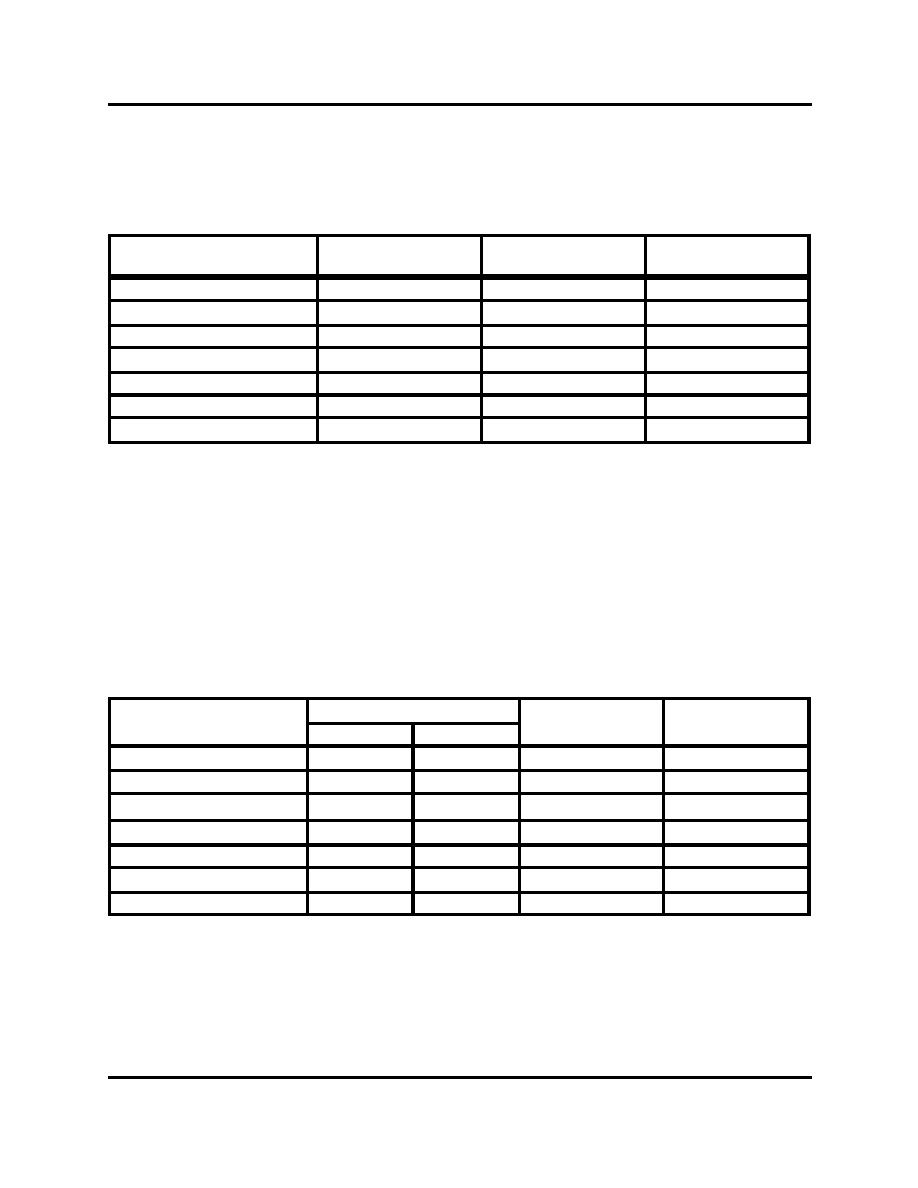
Table 3.8-6
Population and Ethnicity for Del Mar Receiver Site
Project Census Tract
Race/Ethnicity
No. 172
City of Del Mar
San Diego Region
White
4,436
4,514
1,633,281
Black
24
33
149,898
Hispanic(1)
143
177
510,781
Other
172
136
204,056
Total
4,775
4,860
2,498,016
Total Non-White
339
346
864,735
Percent Non-White
7.1%
7.1%
34.6%
(1)
The Hispanic category is an ethnic, rather than a racial, distinction. These tables therefore include only non-Hispanic
individuals in the black, white, and Asian/other categories to avoid double-counting.
Source: SANDAG Demographic and Economic Estimates Profiles (city and regional information) 1990 Census STF 3A
(census tract information)
Table 3.8-7
Population and Ethnicity for City of San Diego Receiver Sites
Project Census Tract(2)
Race/Ethnicity
No. 83.12
No. 76
City of San Diego
San Diego Region
White
3,351
6,323
651,735
1,633,281
Black
13
39
98,852
149,898
Hispanic(1)
110
273
229,519
510,781
Other
166
268
130,443
204,056
Total
3,640
6,903
1,110,549
2,498,016
Total Non-White
289
580
458,814
864,735
Percent Non-White
7.9%
8.4%
41.3%
34.6%
(1)
The Hispanic category is an ethnic, rather than a racial, distinction. These tables therefore include only non-Hispanic
individuals in the black, white, and Asian/other categories to avoid double-counting.
(2)
CT 83.12 contains the Torrey Pines receiver site and CT 76 contains the Mission Beach receiver site.
Source: SANDAG Demographic and Economic Estimates Profiles (city and regional information) 1990 Census STF 3A
(census tract information)
Page 3.8-6
Regional Beach Sand Project EIR/EA
99-69\SANDAG EIREA 3.5 to 3.12.wpd 7/17/00

 Previous Page
