Home
Download PDF
Order CD-ROM
Order in Print
Home
>
Coastal and Hydraulics Laboratory Fact Sheets
>
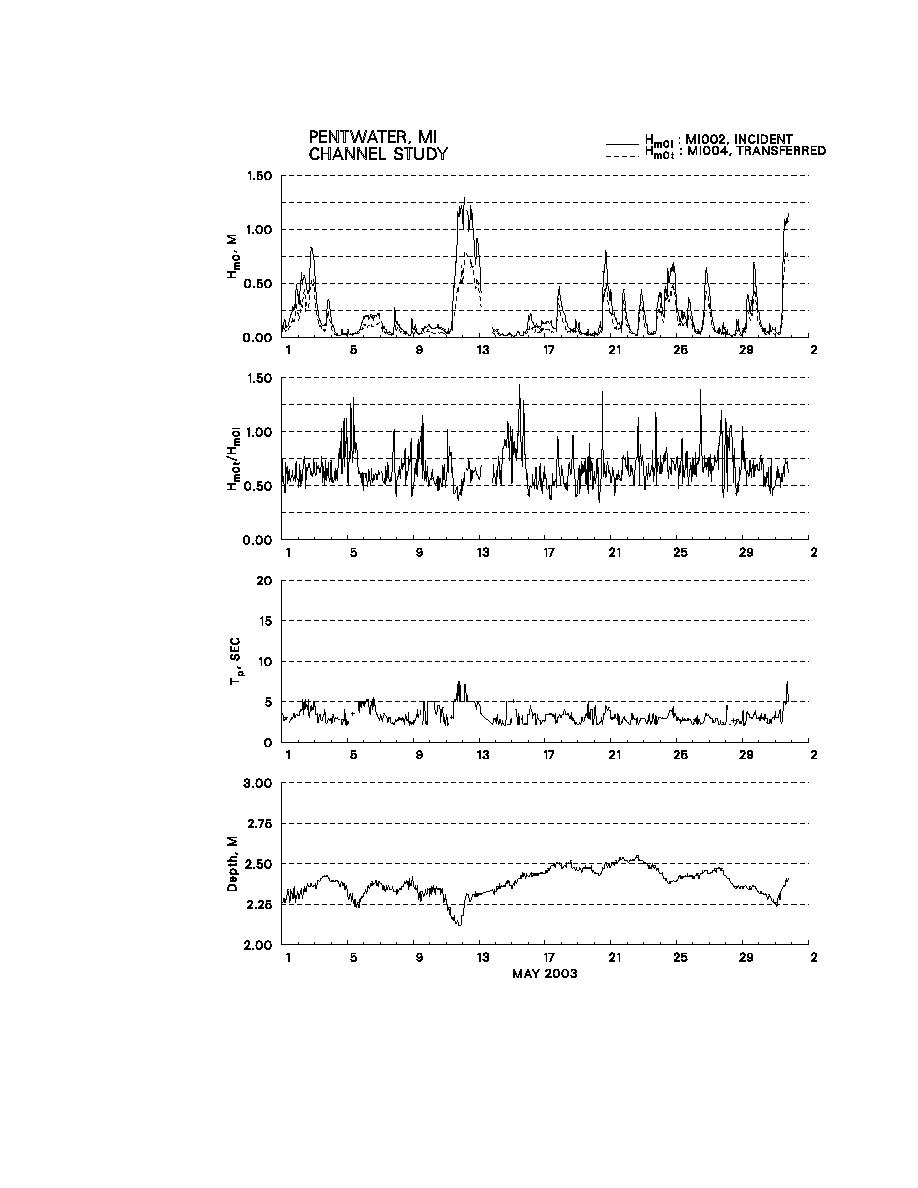
> Figure 3: MI002 & MI004 Hmo comparison, transfer rates, and MI002 Tp and depth for May 2003
Figure 2: MI002 & MI004 Hmo comparison, transfer rates, and MI002 Tp and depth for April 2003 )
Figure 4: Timeseries plots of water level for selected burst with Tp = 128 seconds. Note the very long period oscillations.
pentwater_2003
Page Navigation
2
3
4
5
6
7
8
9
10
11
12
Figure
3:
MI002
&
MI004
H
mo
comparison,
transfer
rates,
and
MI002
T
p
and
depth
for
May
2003.
6


 Previous Page
