

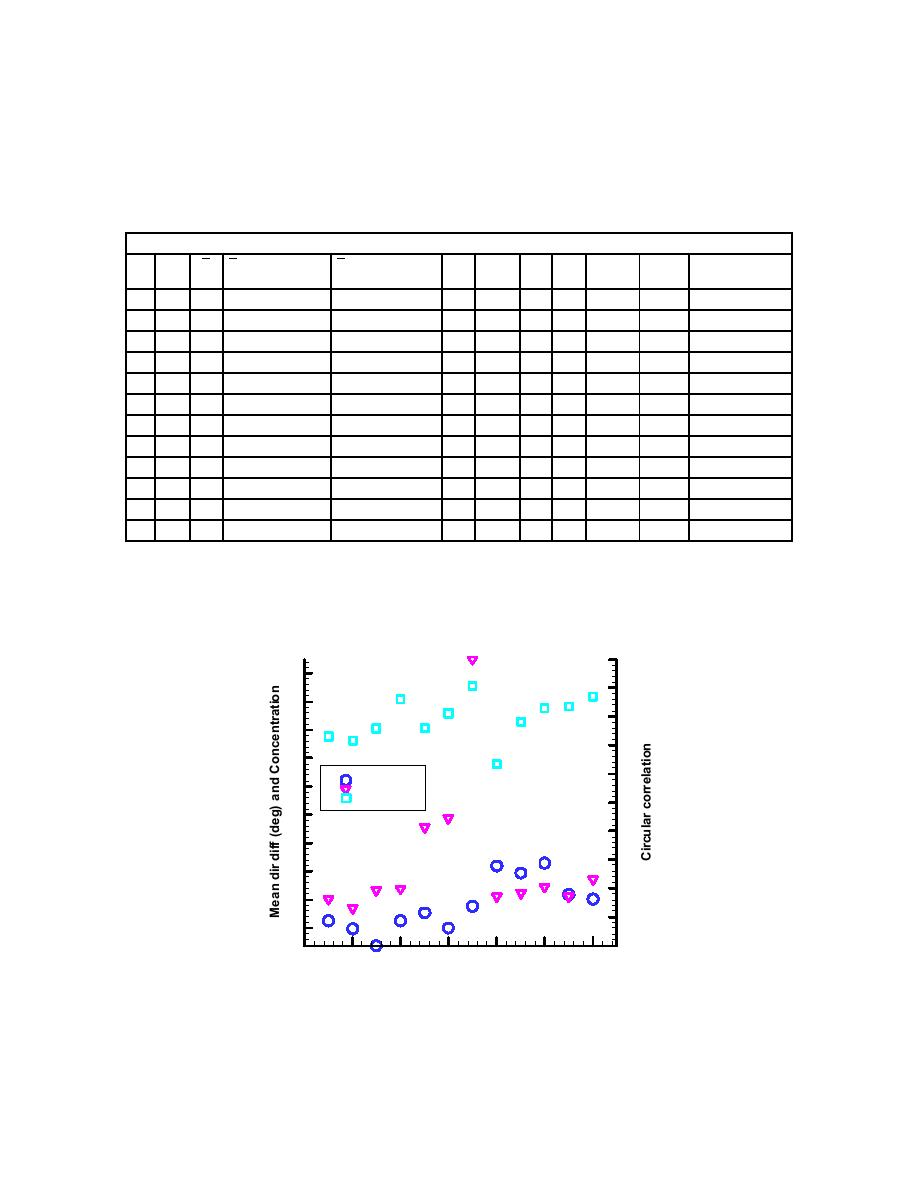
Figure 6 shows the statistics for the directional location at 42019 for 1998. Table 4 gives the numbers
that correspond to this plot. Table 4 has the same format as Table 2. All the mean directional
differences are fairly small. The lowest correlation is in August. Only February shows a concentration
below 5. Figures 7 and 8 show the mean wave directions for July and August, 1998. Both these months
have concentrations below 5.0 but the correlation for August is lower. Note that the August comparisons
show the low correlation as predicted by the statistics.
Table 4. Buoy 42019
x
k
Year Month
Number Cor Circor Resultant Variance Standard deviation
(deg)
(deg)
(deg)
1998
1
1.31
5.59
-2.97
5.07
152
0.824 0.73
0.895
0.105
0.458
1998
2
-0.11
2.85
-3.08
3.49
488
0.855 0.716
0.842
0.158
0.562
1998
3
-3.1
-1.27
-4.92
6.63
622
0.802 0.758
0.921
0.079
0.397
1998
4
1.3
3.33
-0.73
6.94
477
0.895 0.86
0.925
0.075
0.388
1998
5
2.66
4.13
1.2
17.77
340
0.763 0.761
0.971
0.029
0.239
1998
6
-0.04
1.01
-1.08
19.43
609
0.815 0.812
0.974
0.026
0.228
1998
7
3.84
4.91
2.77
47.46
235
0.907 0.907
0.989
0.011
0.146
1998
8
10.93
15.91
5.95
5.53
102
0.647 0.633
0.905
0.095
0.437
1998
9
9.65
11.8
7.5
6.25
476
0.817 0.781
0.916
0.084
0.409
1998
10
11.46
13.28
9.65
7.23
569
0.845 0.83
0.928
0.072
0.379
1998
11
5.95
8.22
3.68
5.61
481
0.896 0.835
0.906
0.094
0.434
1998
12
5.07
7.01
3.13
8.62
414
0.954 0.869
0.94
0.06
0.346
42019
1
45
0.9
40
0.8
35
0.7
30
0.6
Dir diff
25
Concentration
Correlation
0.5
20
0.4
15
0.3
10
0.2
5
0.1
0
0
0
2
4
6
8
10
12
Months in 1998
Figure 6. Statistics for 42019 and WIS for 1998. Plotting is similar to Figure 2.

 Previous Page
