

ERDC/CHL CHETN-IV-55
March 2003
Engineers from the Alaska District spent 3 days conducting tests with the new flow table model. All
of the large-scale flow structures observed in the idealized models during flood and ebb tide were
seen in the 3-D model. This included flow separation at the major headlands, large slow-moving
gyres in the lee of the headlands, and ebb-flow reduction at the Port of Anchorage. The same cross-
channel transport occurred in the 3-D model at approximately the same location as observed in the
idealized model (see Figure 5), but in the 3-D model the cross-channel flow was somewhat weaker.
The weaker current may be attributed to differences between actual and idealized bathymetry. But
overall it was shown that the less expensive idealized models reproduced dominant flow patterns
reasonably well.
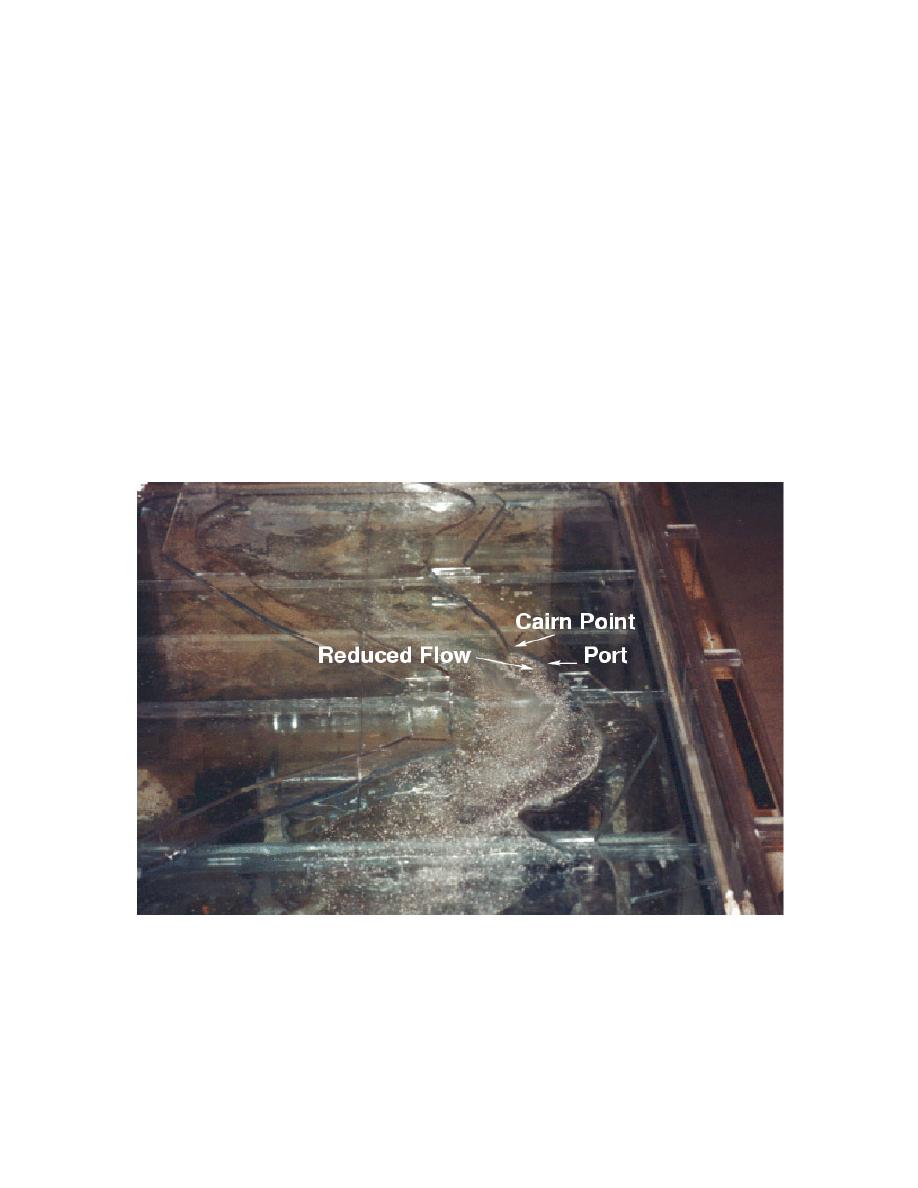
Simulation of maximum ebb flow over the actual bathymetry of the 3-D model generated the same
reduced flow phenomenon at the Port of Anchorage as was observed in the idealized models.
Figure 7 shows ebb currents moving surface tracers (baby powder) past Cairn Point. Most of the
tracer had already moved downstream with the exception of the tracer particles caught in the gyre
formed in the lee of Cairn Point. Within the gyre the tracer particles slowly circulated in a
counterclockwise direction. Fine sediment entrained in the water would have ample opportunity to
deposit on the bottom while trapped in the gyre.
Figure 7. Surface flow tracer showing reduced flow at Port of Anchorage during ebb tide
Alaska District engineers used injected dye to investigate how dredged sediment might move when
deposited from barges at different locations during both ebb and flood flows. Approximate locations
of established dump sites were scaled on the model, and dye was slowly injected at various depths in
the water column. Depending on the flow direction and the injection point, it was not unusual to
observe dye migrating back into the vicinity of the port. Movement of the dye injection location, or
10

 Previous Page
