ERDC/CHL CHETN-IV-55
March 2003
an idealized model of upper Cook Inlet on the flow table. The seaward boundary of the model
(bottom of photograph) reproduced about 19.3 km (12 statute miles) across the width of the flow
table, and the shoreward end extended about 4.8 km (3 miles) upstream of the Port of Anchorage.
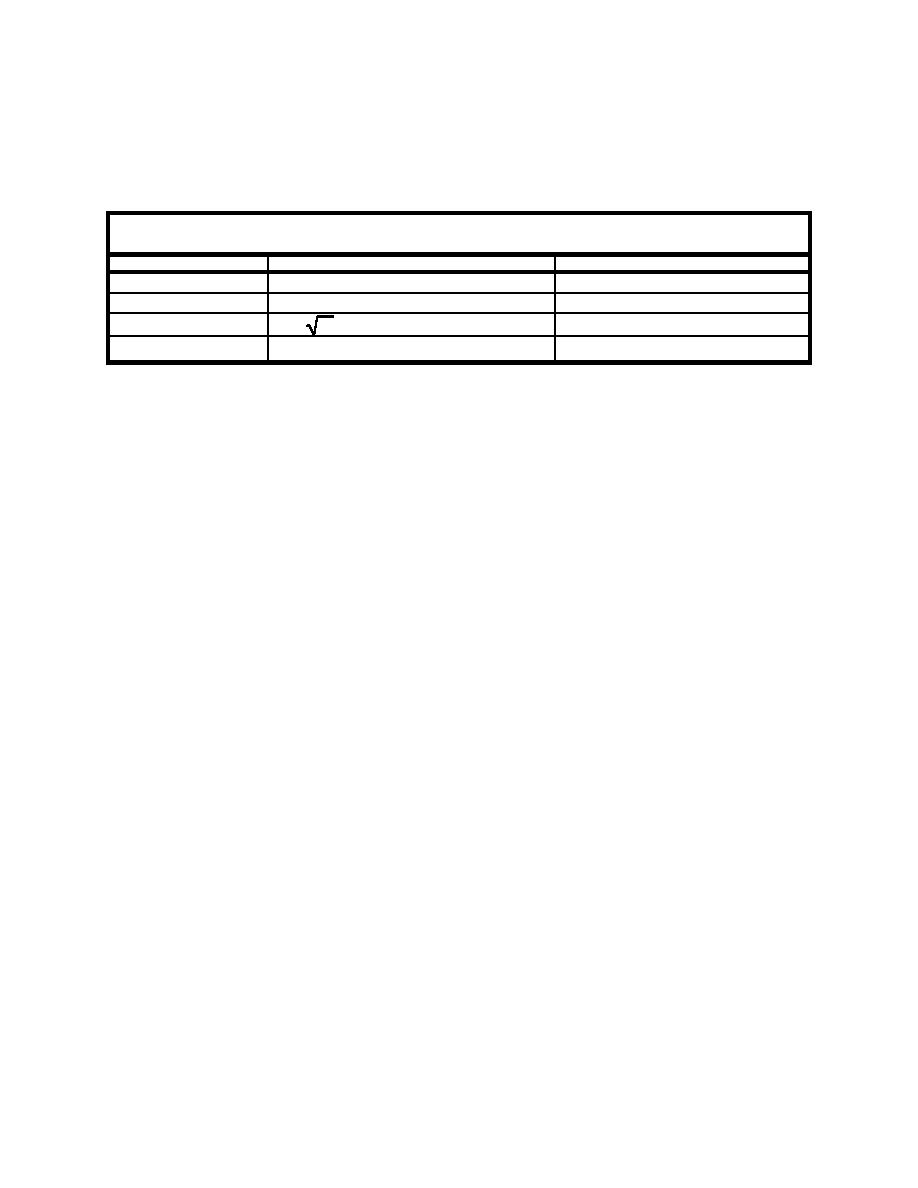
Model scales are given in Table 1.
Table 1
Scale Ratios for Idealized Cook Inlet Model
Scale
Scale Value
Model Equivalence
NX = 15,625
1,300 ft . 1 in
Horizontal scale
NZ = 480
Vertical scale
40 ft = 1 in
NV = NZ = 21.9
2.2 m/s = 10 cm/s
Velocity scale
NQ = NX NZ3/2 = 164,316,767
203,000 m3/s = 1.24 liter/s
Discharge scale
Depths in the model were idealized by two horizontal surfaces located at elevations corresponding to
elevations of 0 ft and -60 ft mllw. Transitions between the two depths were vertical. A second
idealized scale model was also constructed of a smaller area centered on the Port of Anchorage. The
seaward boundary of this model represented about 6.4 km (4 miles) across the inlet with a horizontal
length scale of 1 in. equaling about 940 ft. Depths in this model were idealized by three horizontal
surfaces located at elevations of 0 ft, -30 ft and -60 ft mllw. Transitions between the three depths
were vertical.
The two idealized models were constructed from clear Plexiglass which allowed the LDV to record
velocities through the horizontal surfaces. Shorelines and depth contours were digitized from
nautical charts, and total fabrication cost was about ,000 for both models.
Engineers from the Alaska District traveled to CHL to observe flow patterns in the models. Over a
3-day period, flow patterns were visualized and observed in both idealized models for maximum
flood and ebb flow at different water depths. Flow separation and large vortex regions were evident
in the lee of the major headlands as illustrated by the surface tracers shown in Figure 4. The surface
tracers created patterns that were qualitatively similar to those observed during the spring ice
breakup at Cook Inlet, lending further credibility to the idealized small-scale models.
Figure 5 shows the results of a dye injection that revealed a cross-channel flow along the bottom
moving from right to left in the photograph. Flow separation at Point MacKenzie (left side of
photograph) during flood flow lowers the water surface along the separation boundary, and the
resulting momentum imbalance creates a cross-channel flow at the bottom. In Figure 5 the dye
shows a large region of nearly still water that corresponds closely to the existing mud flats formed in
the lee of Point MacKenzie during flood tide.
The Alaska District engineers also examined alteration of the flow regime that might be caused by
modifications to upstream boundaries. A combination of Plexiglass blocks, small stones, and
modeling clay (silly putty) was used to redirect upstream flow, relocate shoals, and investigate
possible engineering modifications that might alleviate the Port of Anchorage shoaling problem.
7


 Previous Page
