Home
Download PDF
Order CD-ROM
Order in Print
Home
>
Coastal and Hydraulics Laboratory Fact Sheets
>
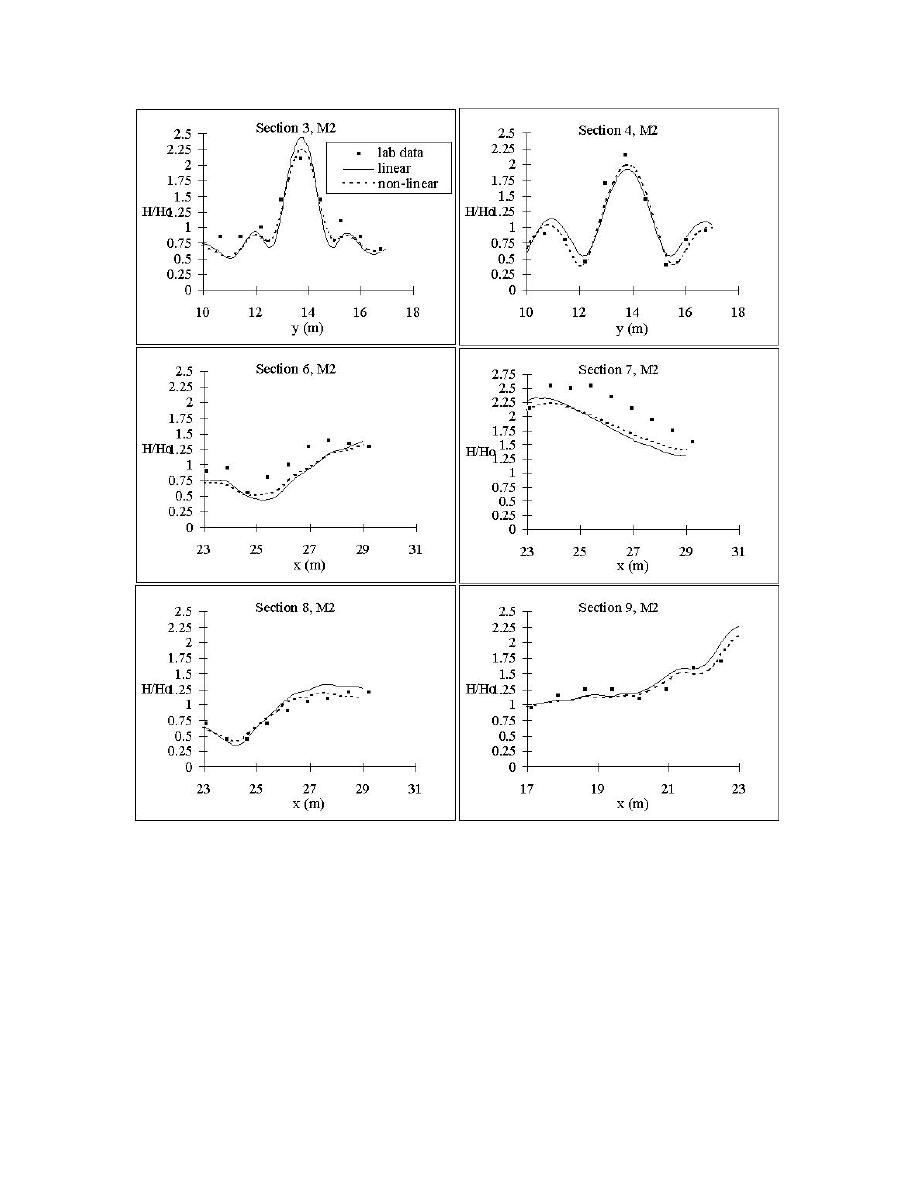
> Figure 14. Wave height comparisons for M2 input condition
Figure 13. Wave height comparisons for M1 input condition
Figure 15. Estimated wave heights for B1 input spectrum, 20directional discretization
cgwave_man3
Page Navigation
83
84
85
86
87
88
89
90
91
92
93
Figure
14.
Wave
height
comparisons
for
M2
input
condition
87


 Previous Page
