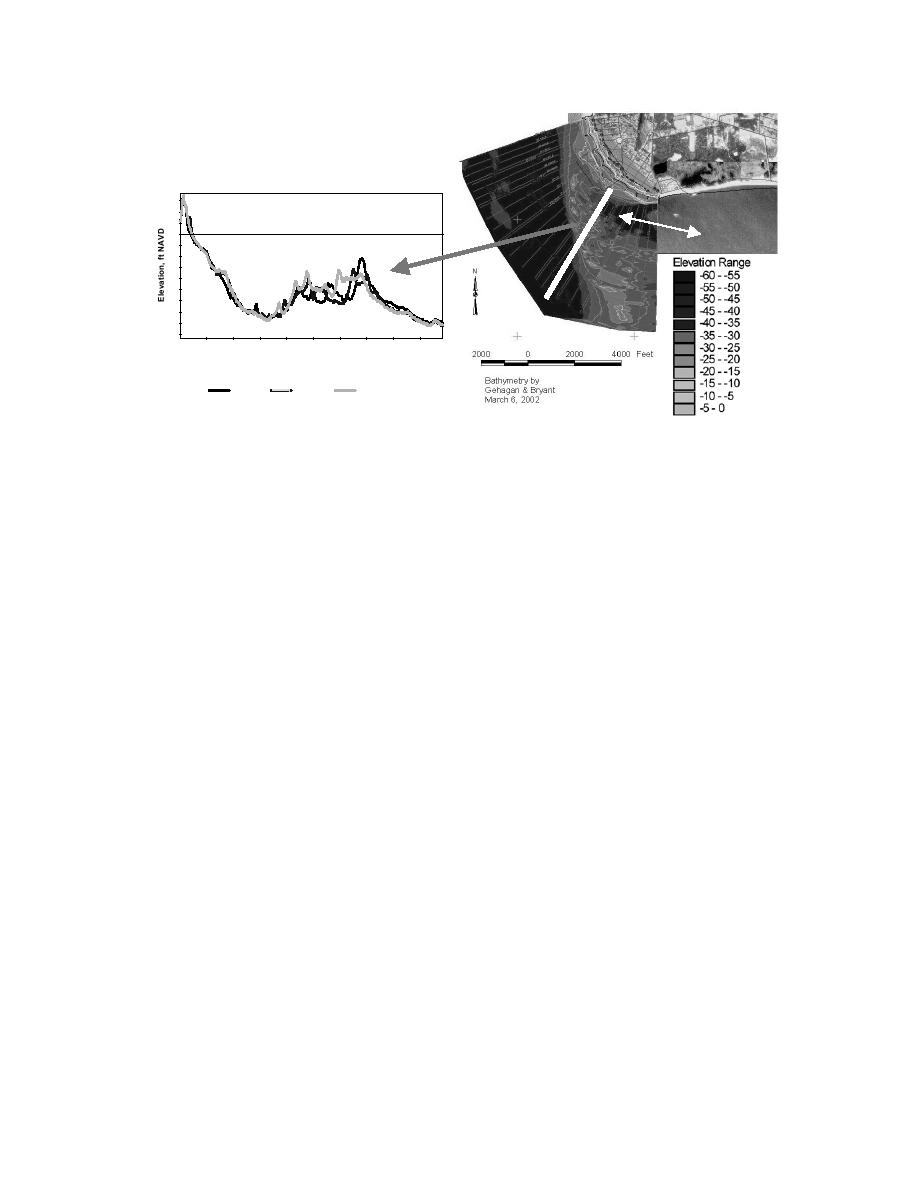
Cape May Point, NJ - Cell 4
Marginal
10
Flood
0
Channel
Marginal
-10
Flood
Shoal
Channel
-20
-30
Shoal
-40
1000
2000
3000
4000
Distance from Baseline, ft
Jul 2000
Jan 2001
Mar 2002
Figure 7. Local bathymetry of shoal and marginal flood channel, with example of one
of 29 profile lines
the test structures relative to the control cells. Three-dimensional bathymetric change
analysis in a GIS will provide patterns of sediment change and evaluate both profile sand
volume retained and shoreline evolution. The shoreline is defined as the mean high water
(MHW) datum, which is 0.54 m above NAVD88 relative to the closest tide gage at Cape
May Canal, 3.8 km north of the study site.
Settlement and Scour
In order to determine the settlement of the sill or breakwater crest, elevation
measurements are taken along the crest of each sill/breakwater structure. These
measurements are taken concurrent with the beach profile surveys. The top of the
Beachsaver Reef was measured at the crest of the unit and the top of the Double-T sill
was measured on top of the seaward vertical leg (Figure 8). Settlement and reorientation
of both structures will be evaluated. Settlement occurred quickly (within the first three
months after installation) in monitoring other prefabricated reef projects (Stauble and
Tabar in press). Scour at the base of the units will also be monitored with careful
surveying at the seaward and landward base of the units to monitor any scour trough
formation or realignment of either type of structure.
As each Beachsaver Reef unit was placed, detailed measurements were made of
the tops of the units and its orientation as placed. The Beachsaver Reef units were
placed between 16 August and 25 September 2002. A post-construction survey was
obtained of both the Beachsaver Reef and Double-T sill unit crests after final placement
of the last Double-T unit on 7 October 2002. Since the Double-T sill only required four
days to be completely installed (between 26 September and 2 October 2002), only a
single survey of the tops of these units was done on 7 October 2002. Figure 8 shows the
11


 Previous Page
