

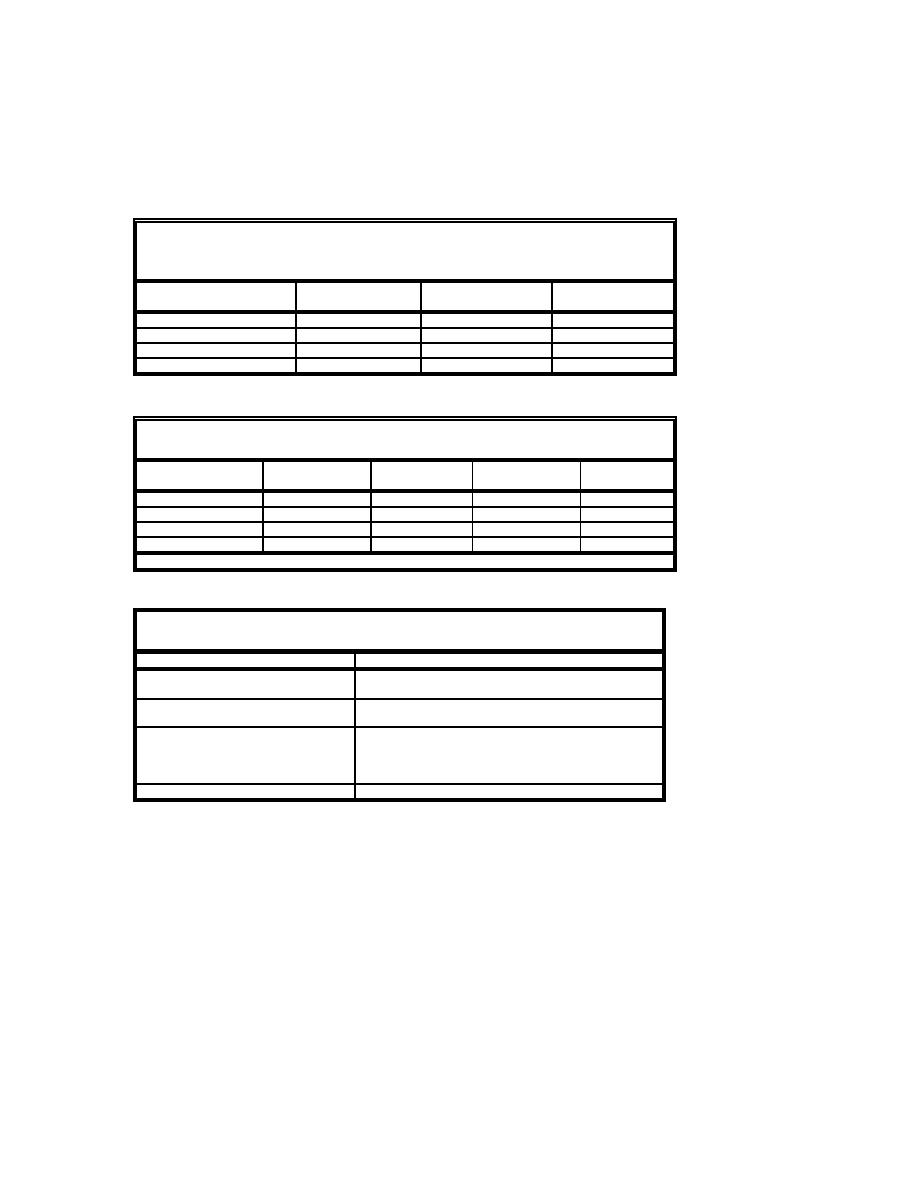
Table 1
Effort Required to Construct, Repair, and Remove The Flood-
Fighting Structures
Construction
Repairs
Removal
Structure
(man-hrs)
(man-hrs)
(man-hrs)
Sandbags
205.1
4.0
9.0
HESCO Bastion
20.8
1.8
13.4
RDFW
32.8
4.6
42.0
Portadam
24.4
2.0
4.4
Table 2
Seepage Rates During Static Head Tests
1 ft Head
2 ft Head
95% Head
Average
Structure
(gpm/ft)
(gpm/ft)
(gpm/ft)
(gpm/ft)
Sandbags
0.05
0.23
0.54
0.27
HESCO Bastion
0.39
0.94
1.81
1.05
RDFW
0.02
0.08
0.10
0.07
Portadam
0.10
0.14
0.14
0.13
Note: gpm/ft = gallons per minute per linear foot of structure.
Table 3
Structure Damage During Laboratory Testing
Structure
Observed Damage
Sandbags
Repeatedly Damaged By Waves
Failed During Overtopping
HESCO Bastion
Minor Sand Settling and Washout
Some Bending of Wire During Debris Impact
RDFW
Minor Sand Settling
Significant Washout Along Edges and Toe
Toe Damaged During Large Waves or Overtopping
10% of Structure Broken
Portadam
Impermeable Liner Torn During Debris Impact

 Previous Page
